Read the headings and boxed notes. You will get the skeleton.
Proof-of-work cycle
Kaspa price, hash rate, and the mining cycle
A price chart is behavior. Hash rate is behavior. Before diagnosing either one, ask what machinery produced it: coins, machines, electricity, miners, holders, emissions, fees, panic, patience, and time.
Summary: This is a guided dissection of a proof-of-work market. It is not a price call, a miner-profitability calculator, or investment advice.
Use the side images and expand button. The diagrams show the joints.
Open the foldouts when a chart, market-cap claim, or miner behavior needs anatomy.
Snapshot
Checked July 1, 2026
CoinGecko API read about $0.0303 per KAS. Coinbase lists the all-time high as $0.2075.
2Miners showed about 350.54 PH/s. The Kaspa wiki timeline recorded 500 TH/s on November 29, 2022.
The public Kaspa API returned about 27.546B KAS circulating out of about 28.704B KAS maximum supply.
The public Kaspa API returned 2.59565436 KAS per block after Toccata activation in the 10 BPS era.
Treat these like a lab note. They age. The hash-rate comparison is deliberately rough: 350 PH/s is about 700 times the wiki's 500 TH/s milestone from late 2022.
The two markets
Start with the visible behavior: the price line moves, the hash-rate line moves, and everyone argues about what it means.
The first answer is almost always too simple. A proof-of-work coin has a coin market and a machine market. The coin market is nervous and fast. Buyers, sellers, holders, traders, exchanges, attention, fear, and leverage can reprice KAS before lunch.
The machine market is slow and stubborn. Miners order ASICs, wait for production, wait for shipping, find hosting, wire power, tune firmware, join pools, sell old machines, or shut machines off. This is where people get fooled. They expect the machine market to answer the coin market instantly. It cannot.
So you get strange-looking moments. Price can fall while hash rate keeps rising because machines ordered months earlier are still arriving. Hash rate can fall while the network remains far stronger than it was in an earlier era. Price can rise before miners can react. Used ASIC prices can collapse after new ASIC production overshoots demand. The charts are talking to each other, usually with a delay.
This is game theory with a power cord. Miners chase profit. Holders chase exits or patience. Buyers chase a price they can live with. ASIC makers chase demand. None of them needs to be evil or heroic. They only need incentives.
The dated snapshot shows the scale problem. Kaspa is far below its listed all-time high, and still far above the early exchange and OTC era. Hash rate is below recent peaks, and still hundreds of times above the late-2022 wiki milestone. A downtrend and a long-range buildout can sit on the same page.
If you only remember one thing, remember the lag: coins can move today, machines answer later.
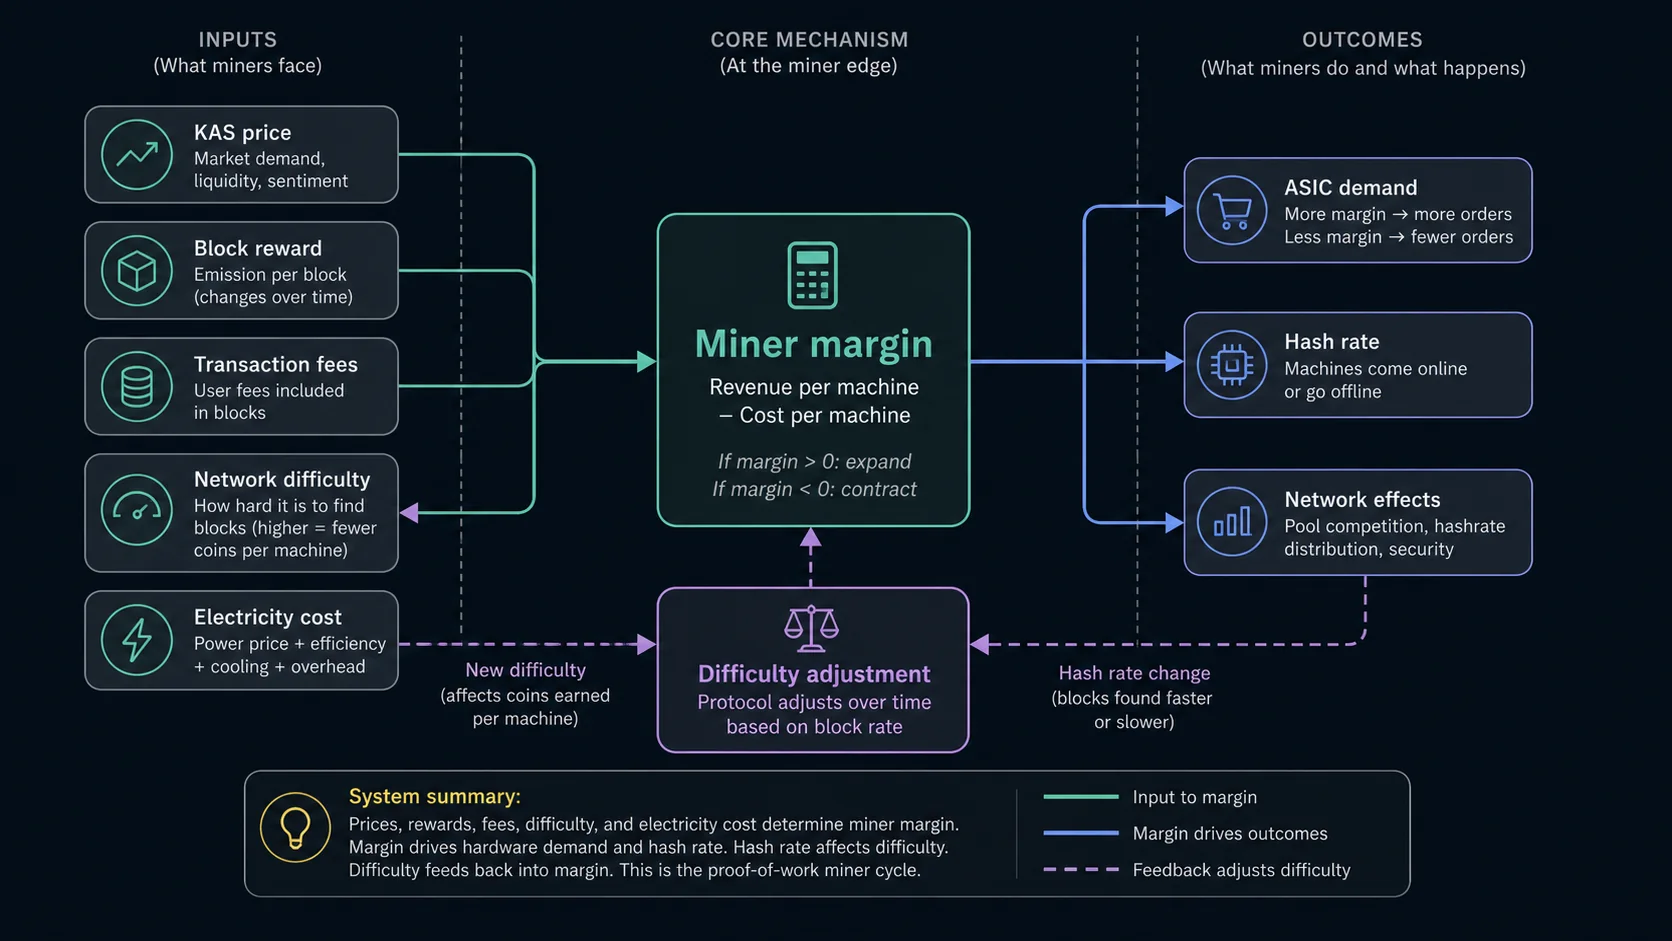
Mechanism
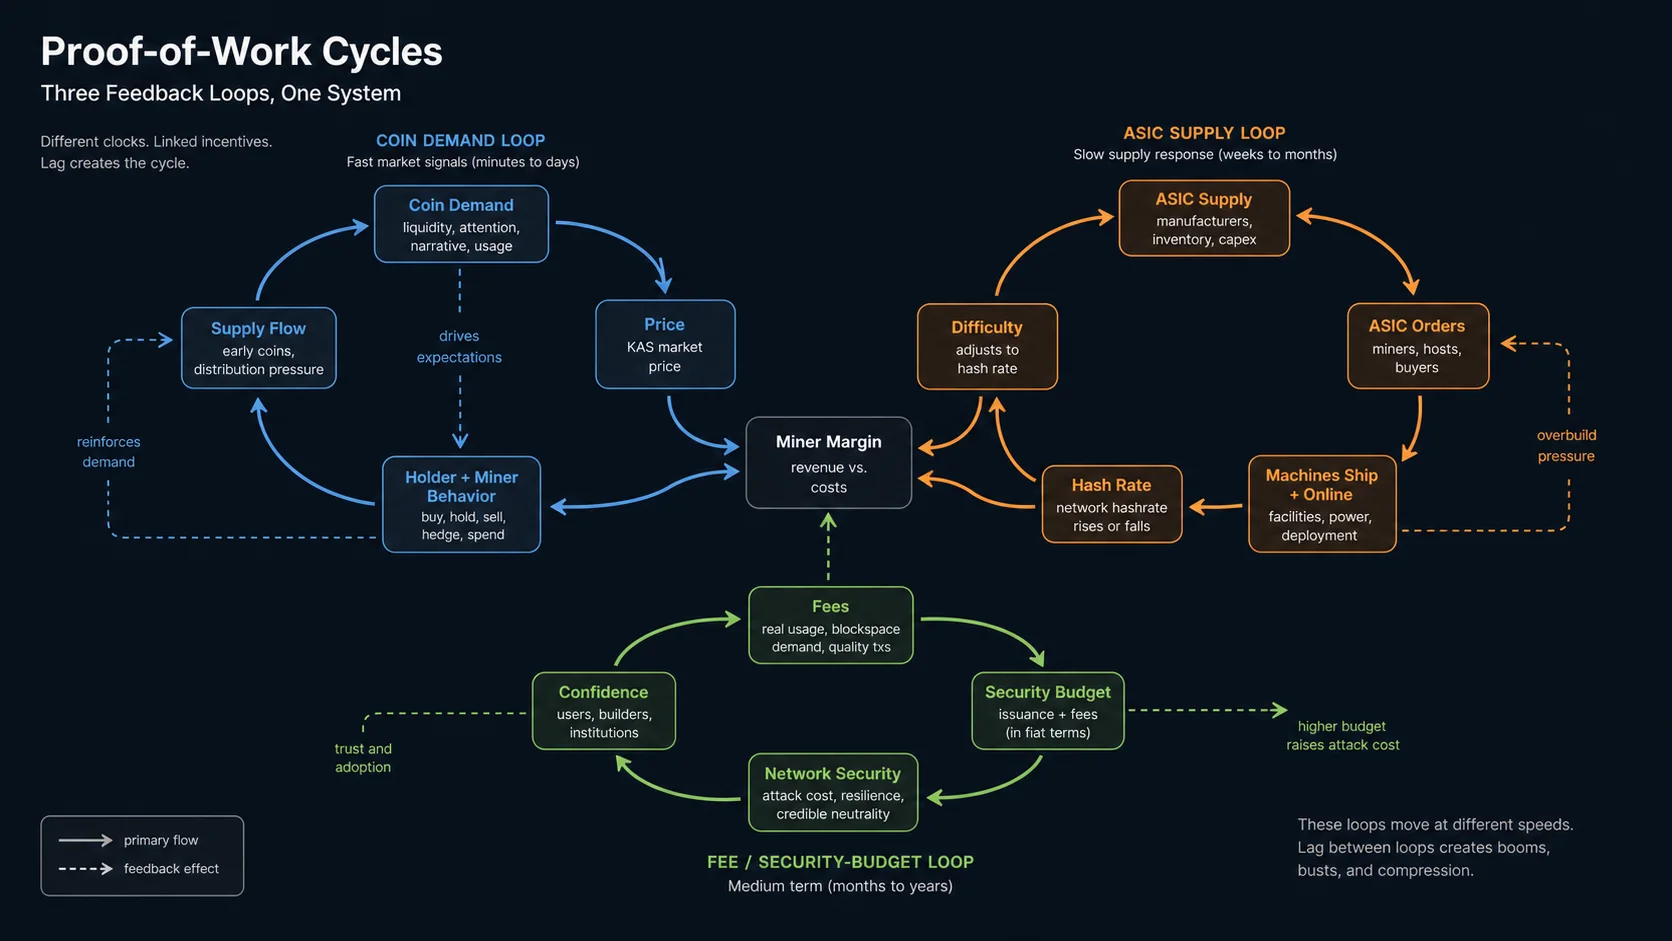
One system, different clocks
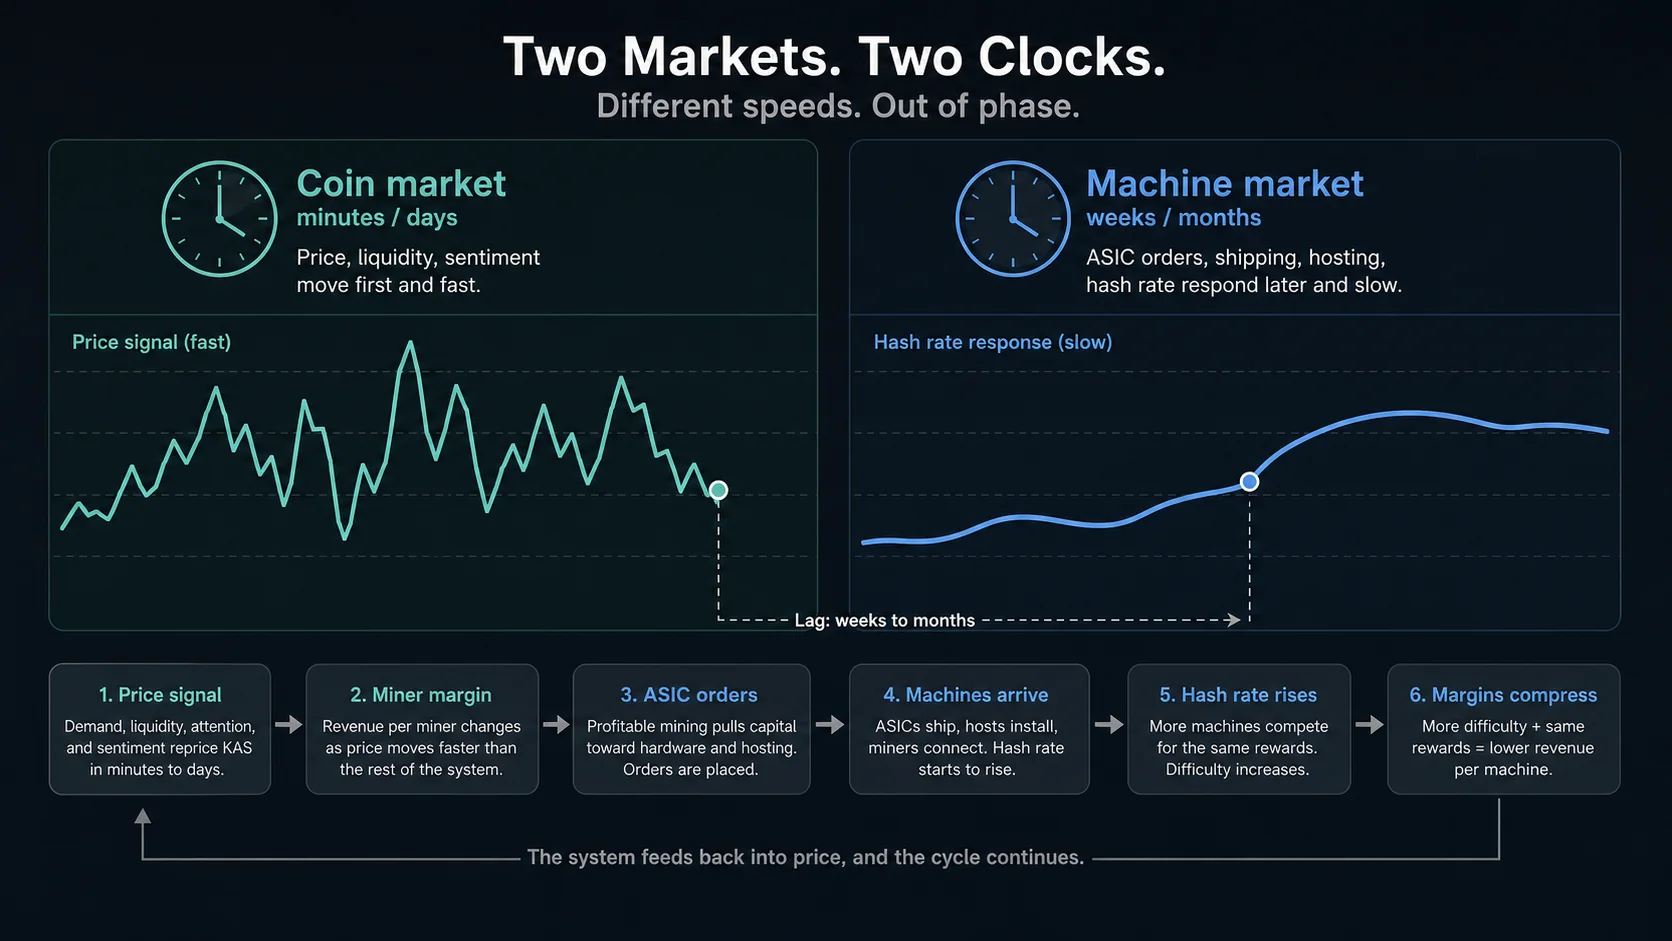
Coin market
minutes to days
price, liquidity, sentiment
Machine market
weeks to months
ASIC orders, shipping, hosting, hash rate, difficulty
Demand, liquidity, attention, and holder behavior can move KAS quickly.
Price, reward, fees, difficulty, and power cost decide the miner's day.
Profitable mining pulls capital toward hardware and hosting.
ASICs can keep coming online after the price signal that caused the order has faded.
More machines compete for the same issuance schedule, so each machine earns less KAS.
Hardware, coins, and conviction move to whoever can survive the bad part.
Visual shelf: market lag and miner margin
ASICs buy security, with a bill attached
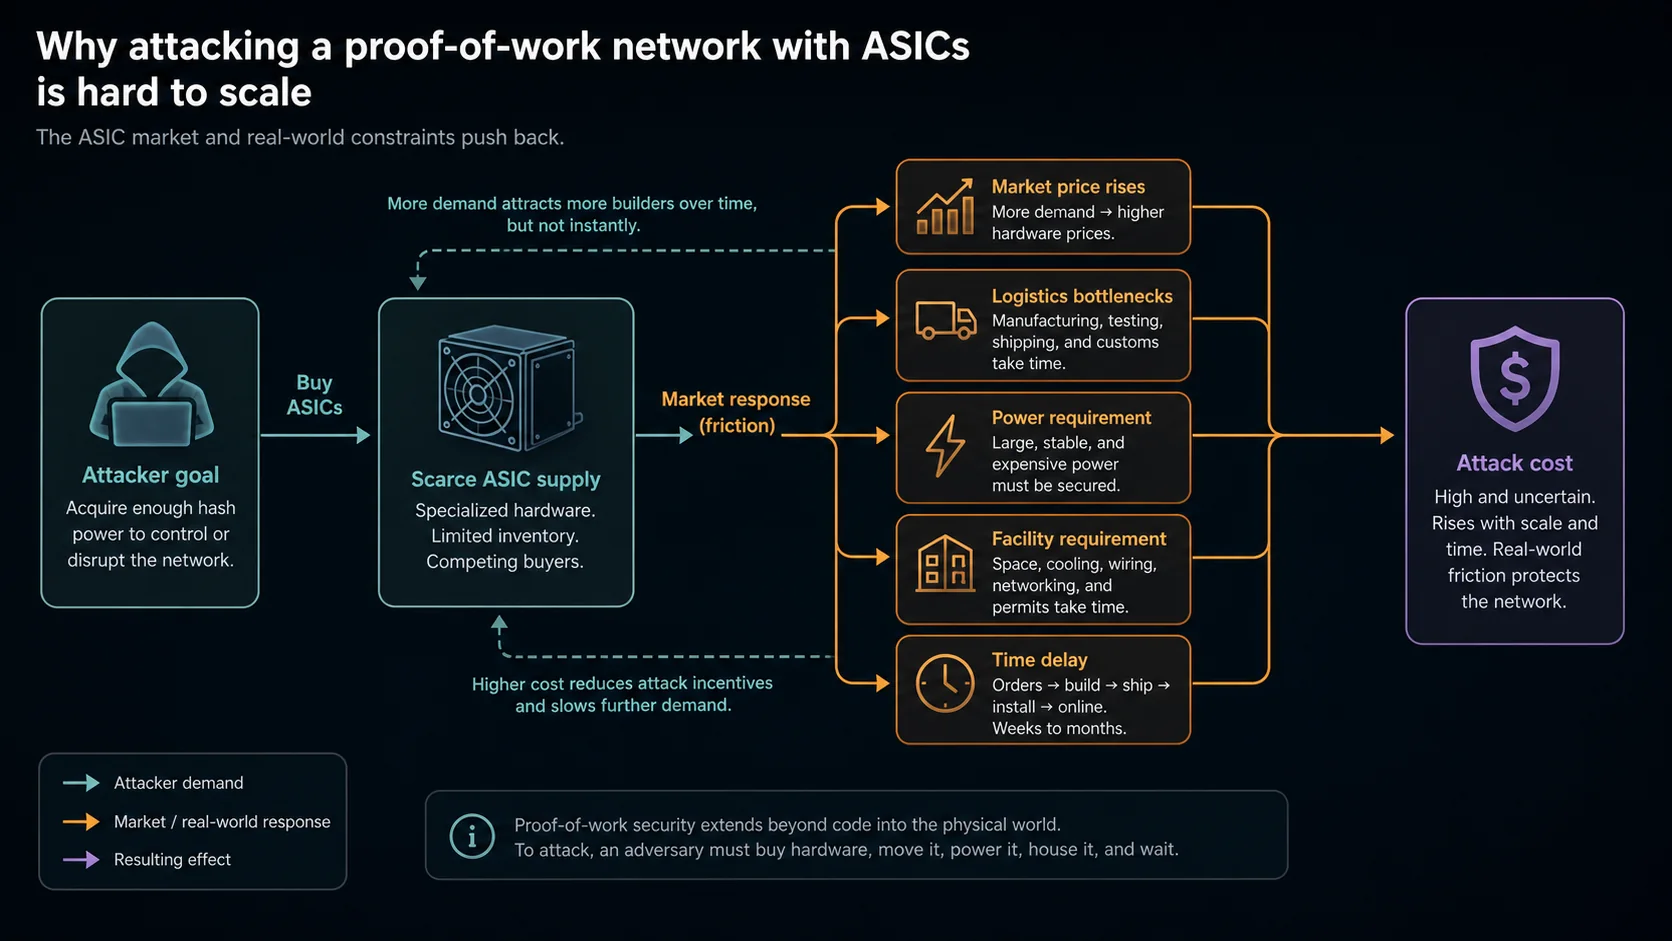
ASICs are where the abstract crypto argument runs into a loading dock.
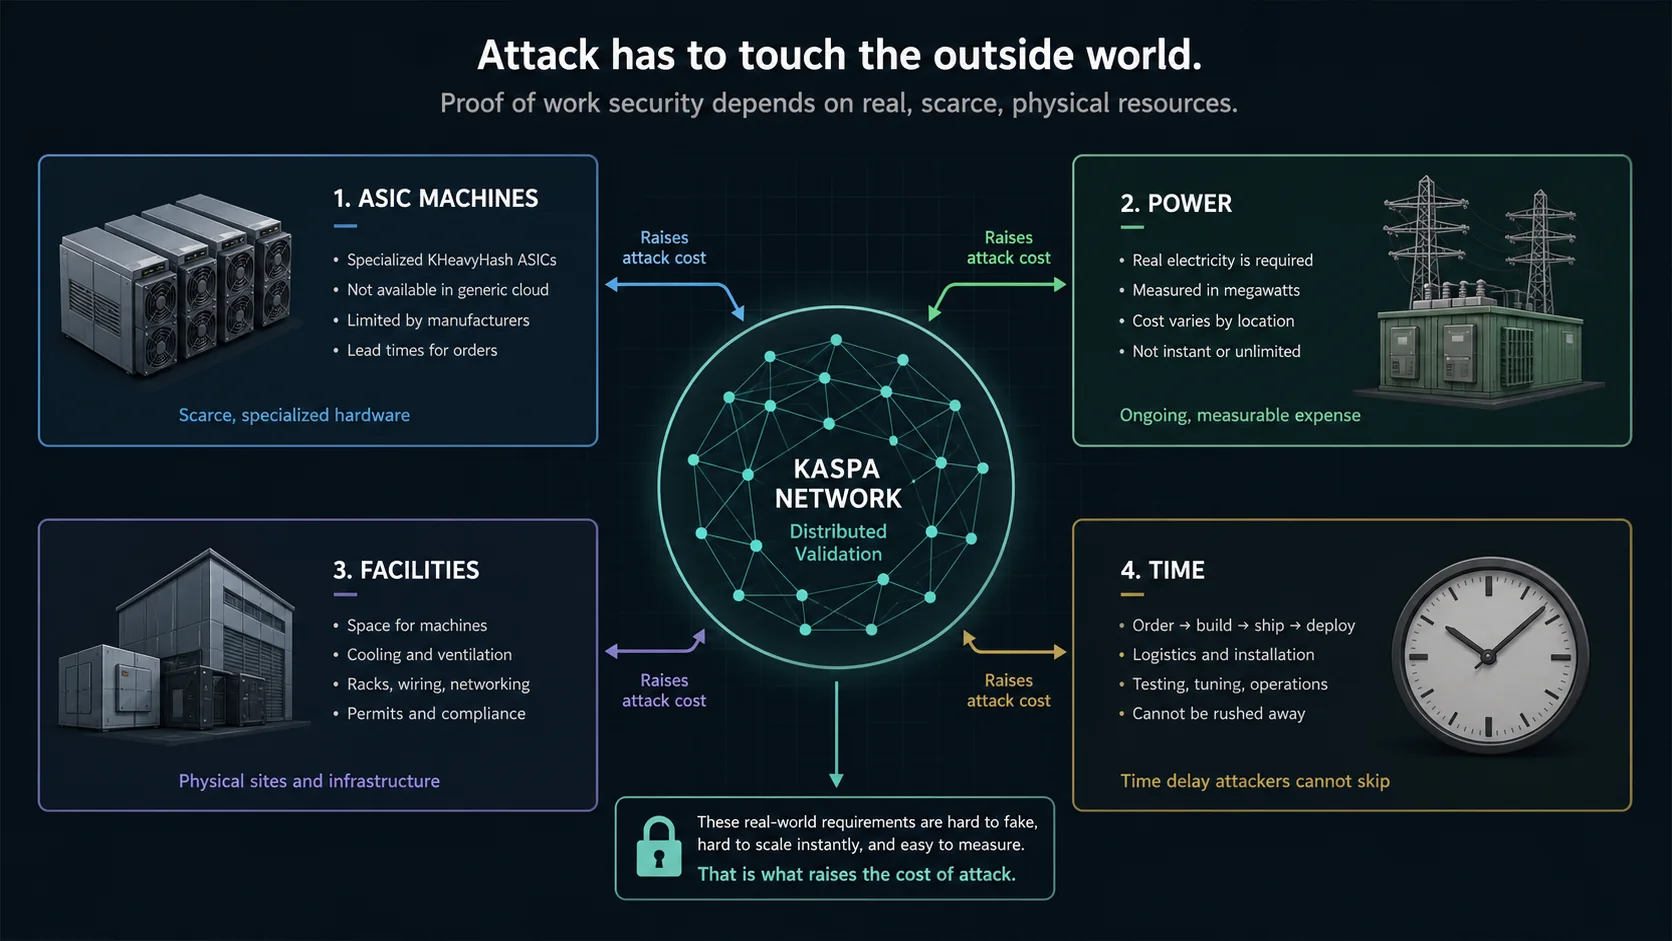
A Kaspa attacker cannot rent generic cloud compute and point it at the network. They need specialized KHeavyHash machines, electricity, facilities, cooling, firmware, logistics, pools or solo-mining paths, and time. The attack has to leave the spreadsheet and enter the world.
The bill is real. ASICs raise the cost of mining participation. They give ASIC manufacturers, large buyers, cheap-power operators, firmware vendors, pools, and hosting sites real influence. Used markets and more independent operators can spread that influence around. A few dominant actors can pull it inward again.
The precise claim: ASICs harden the network, and ASIC distribution still matters.
Electricity is the point
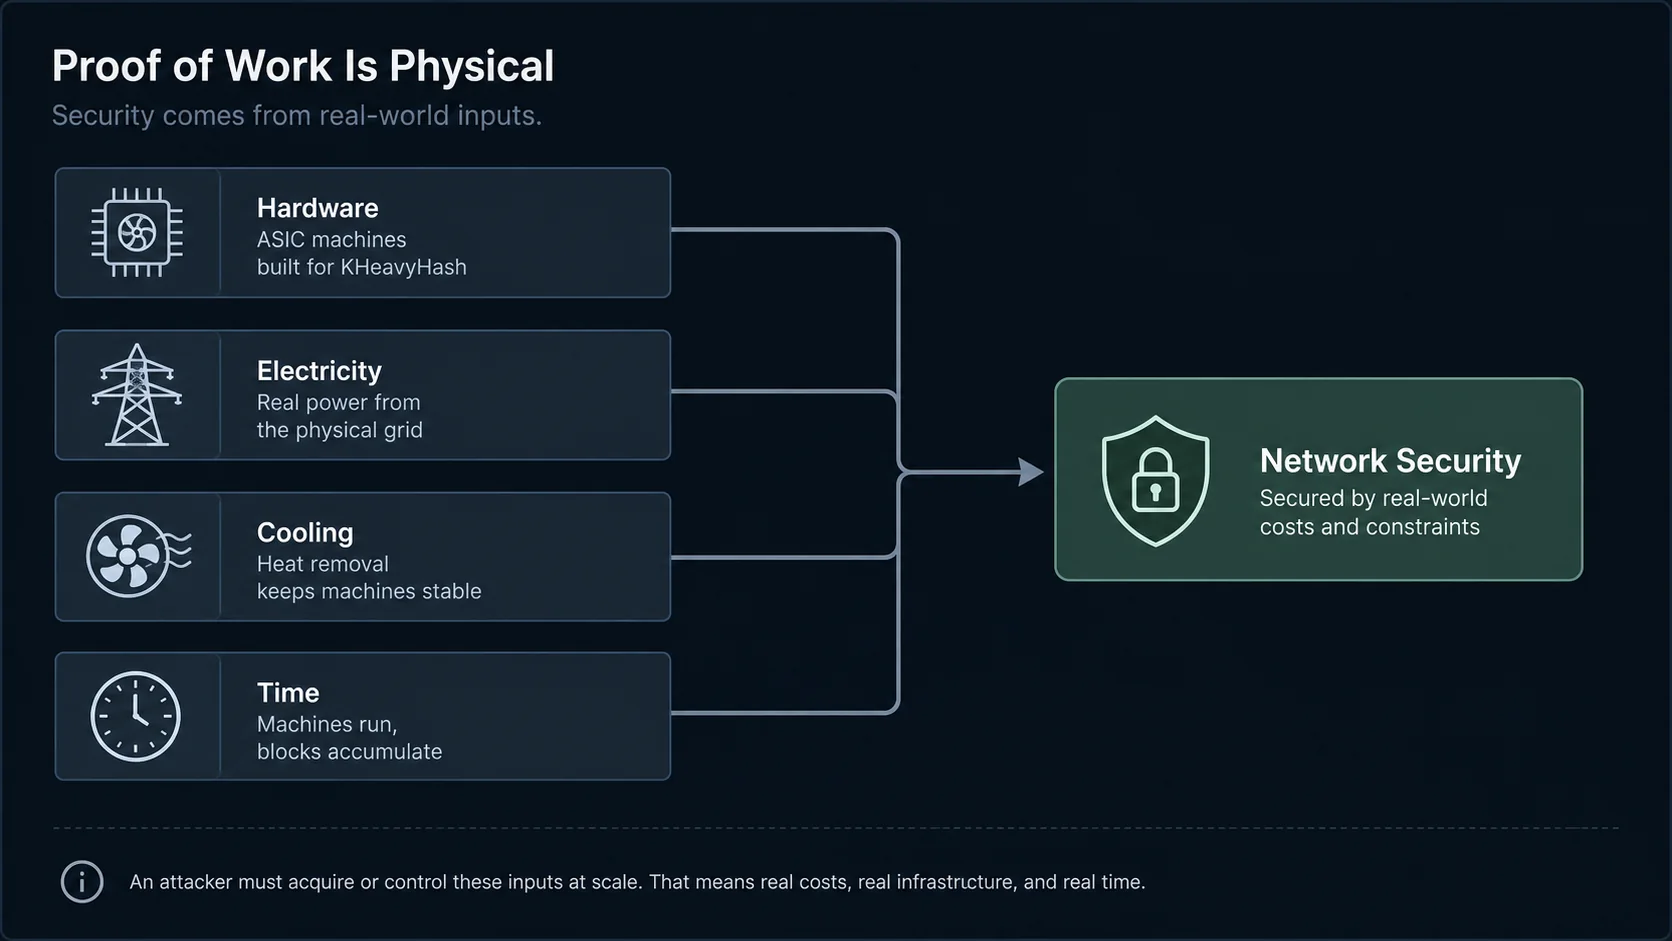
Proof of work turns digital security into a physical argument. Electricity, hardware, heat, buildings, shipping, capital, and time all become part of the security budget. The network has a metabolism.
Proof of stake asks holders to lock the asset and follow validator rules. Proof of work brings in a different cast of characters: miners with power bills, hosting contracts, repair problems, firmware choices, debt, taxes, and machines aging in the real world.
That is awkward. It is also the point. PoW lets outside actors enter through machines, power, hosting, firmware, pools, and repair. Those externalities bring cost, friction, and new power centers. They also make the system harder to fake because security has to be paid for outside the screen.
Go deeper: why electricity changes the social shape
Imagine two games. In one game, people who already hold the coin help secure the coin. In the other game, people have to buy machines, find power, and run an operation. Kaspa is in the second game.
That creates mess. It also creates friction an attacker has to deal with. They need machines, power, and a wallet balance large enough to make the attack worth attempting.
Visual shelf: attack cost and physical inputs
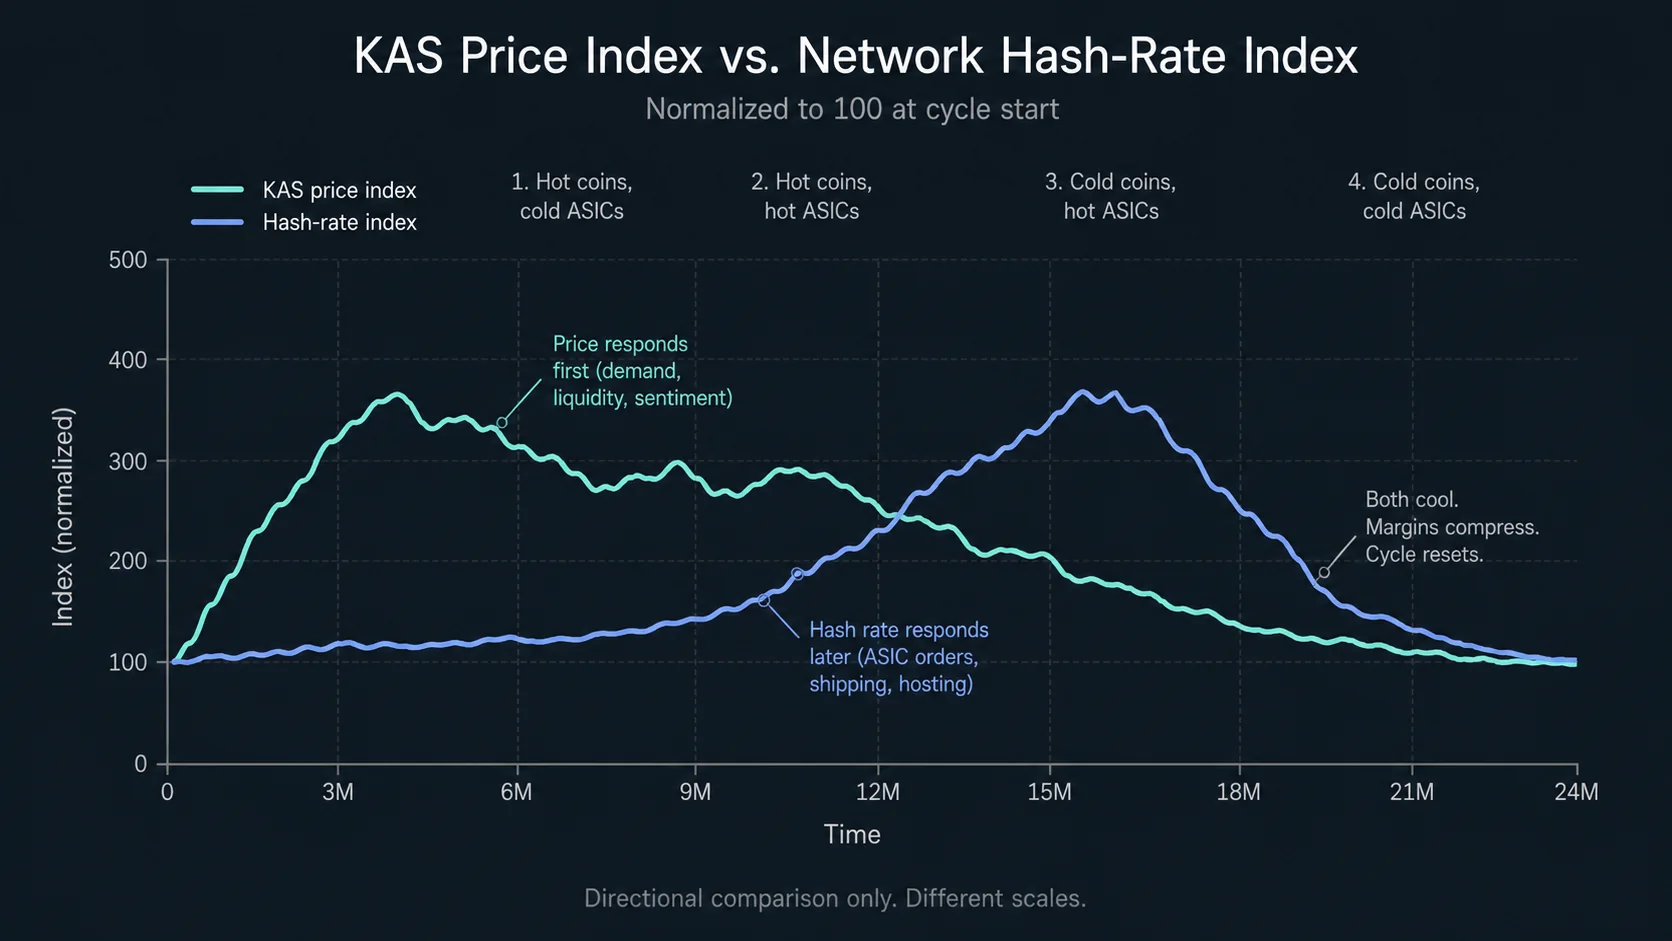
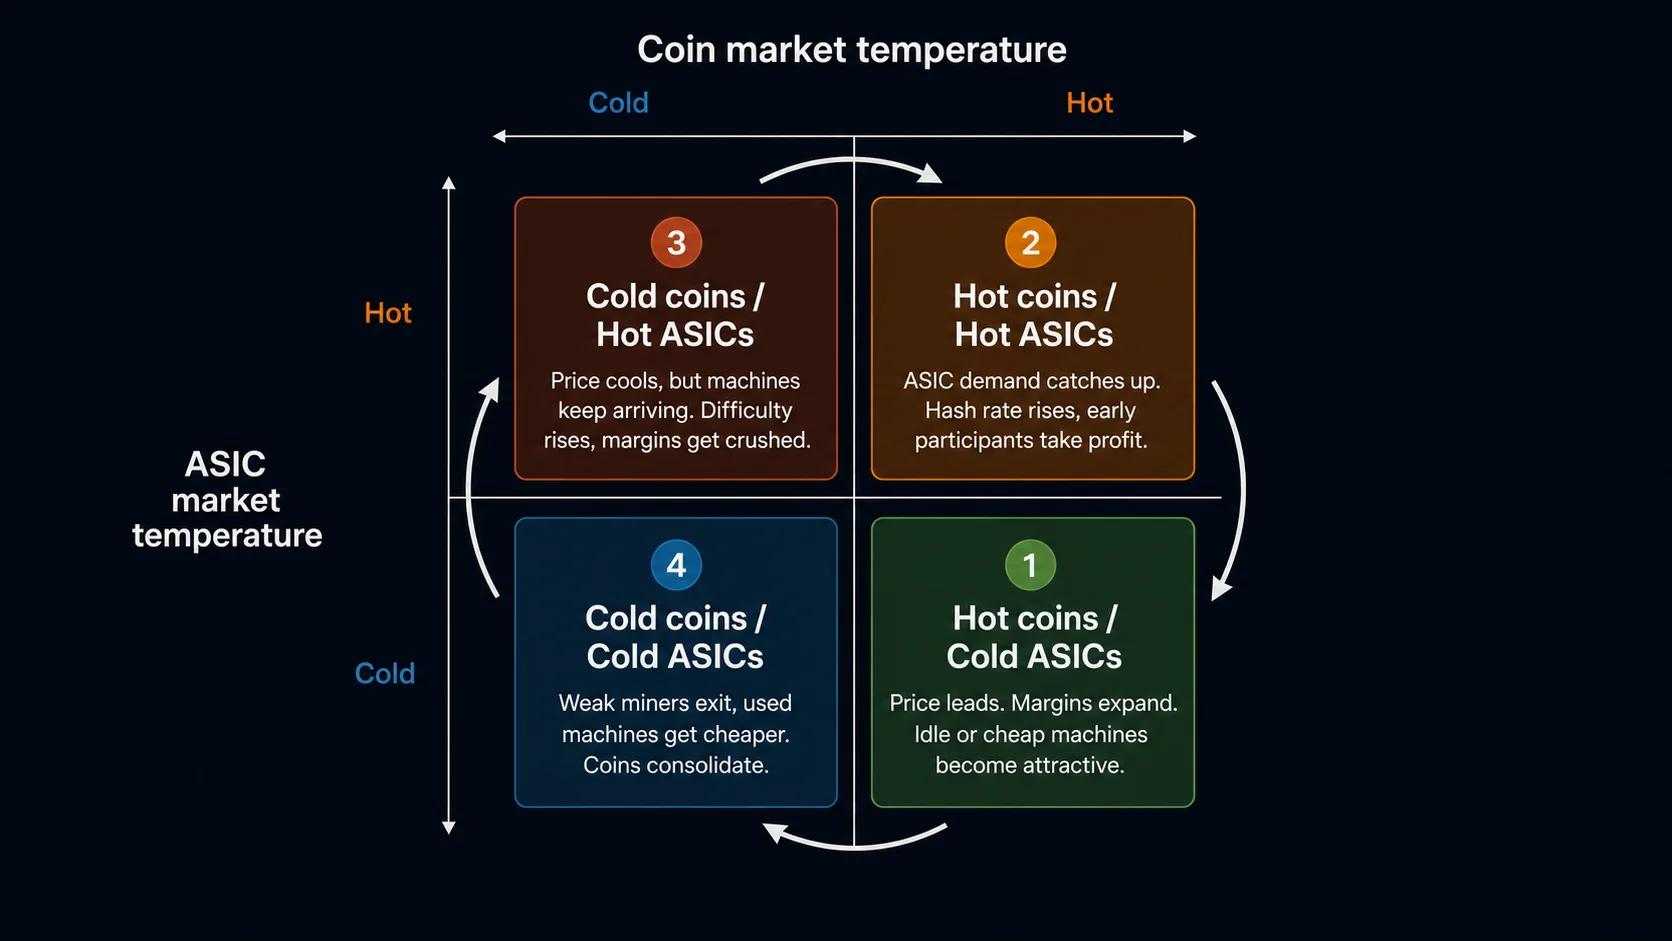
Cycle model
Coins and ASICs heat and cool at different times
This framing borrows from @Themooseisloos5, who has written about Kaspa's coin-and-ASIC cycle as a Carnot-engine style model. I am using it as a picture of lagged incentives. Do not worship the metaphor. Watch the delay.
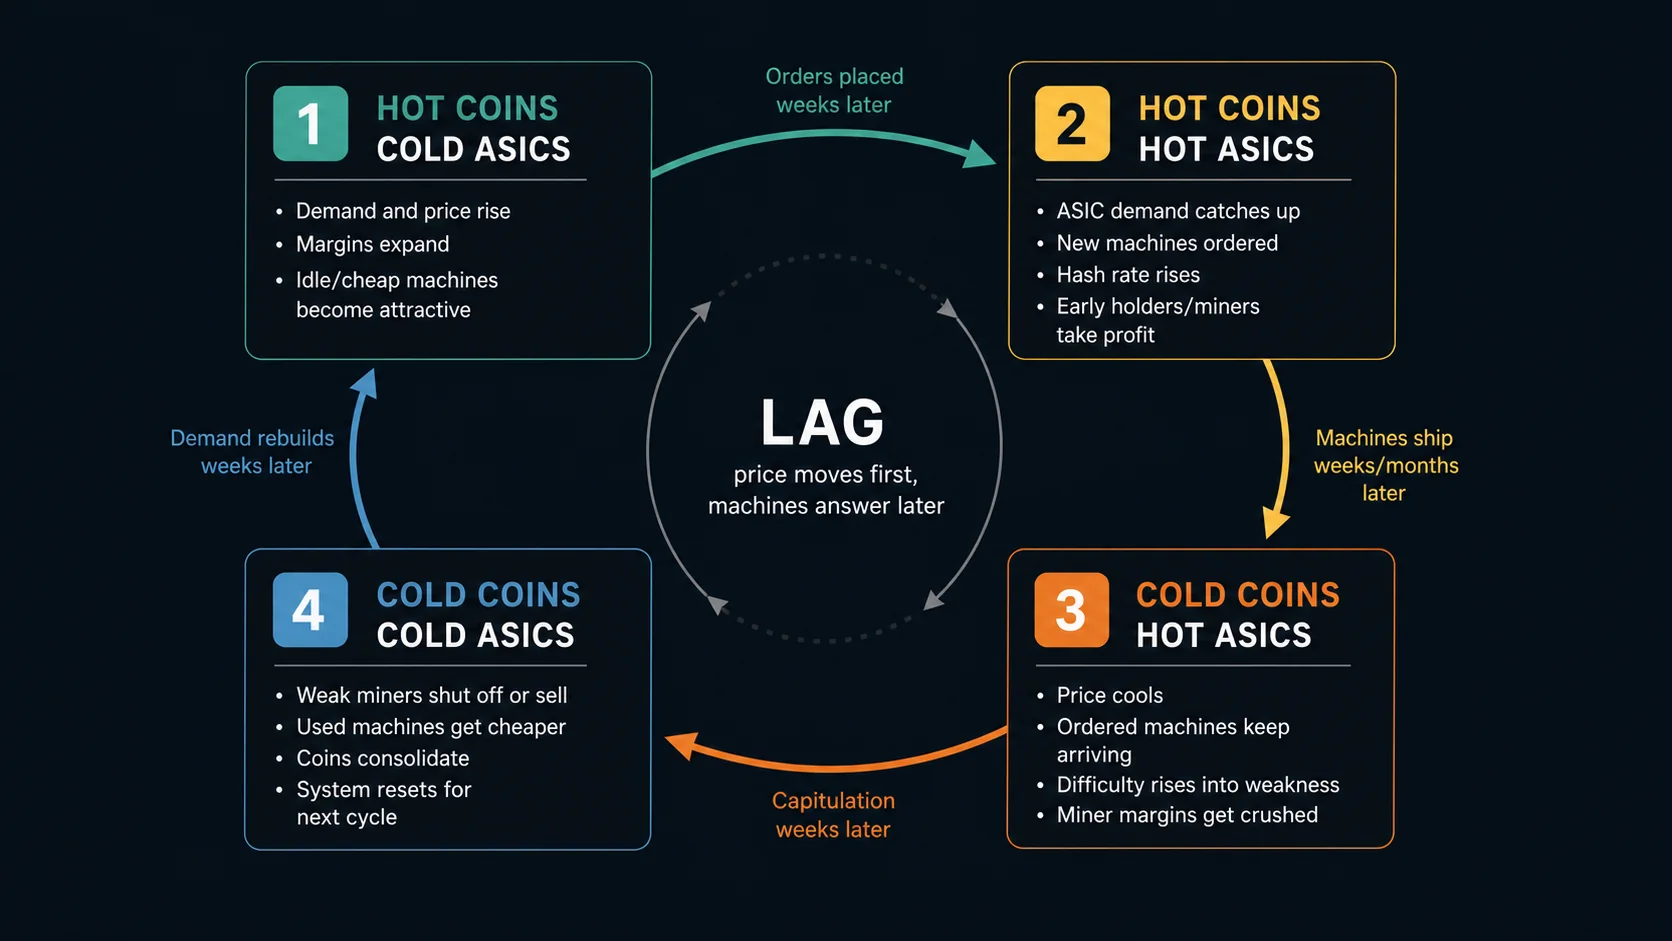
Cold ASICs
Hot ASICs
Hot ASICs
Cold ASICs
lag
price moves first, machines answer later
Hot coins, cold ASICs
Demand moves into KAS before hardware can fully respond. Price rises, mining margins expand, and cheap or idle machines suddenly look interesting.
Hot coins, hot ASICs
ASIC demand catches up. New machines get ordered, old machines get repriced, hash rate rises, and early holders or miners may take profit.
Cold coins, hot ASICs
Price cools, but machines already ordered keep arriving. Difficulty can rise into weakness. Miner margins get crushed.
Cold coins, cold ASICs
Weak miners shut off or sell. Used machines get cheaper. Coins consolidate. The system compresses until demand, hardware, and conviction find another balance.
Young networks move violently
Markets have moods. Hardware has lead times. Miners have bills. ASIC manufacturers have inventory. Holders have different pain thresholds. Crypto takes all of that and runs it at unpleasant speed.
Kaspa's first cycle was compressed. Fair launch, fast emissions, GPU mining, ASICs, exchange discovery, price discovery, and a huge mining buildout all landed in a short historical window. Bitcoin had slower early distribution, slower hardware maturation, slower exchange access, and slower public understanding. Kaspa compressed several discovery phases into one violent first run. Toccata came later, into a network whose early cycle was already unusually fast.
That can create a bigger up and a bigger down. Maybe that becomes a stronger base. Maybe it does not. You only know one, two, five years later, if you know at all.
That uncertainty is uncomfortable, and it is real. The same outside-world constraints that make proof of work hard to fake also make it messy: hardware, electricity, miners, sellers, buyers, panic, and conviction.
Fast emissions helped distribution and made the cycle harsher
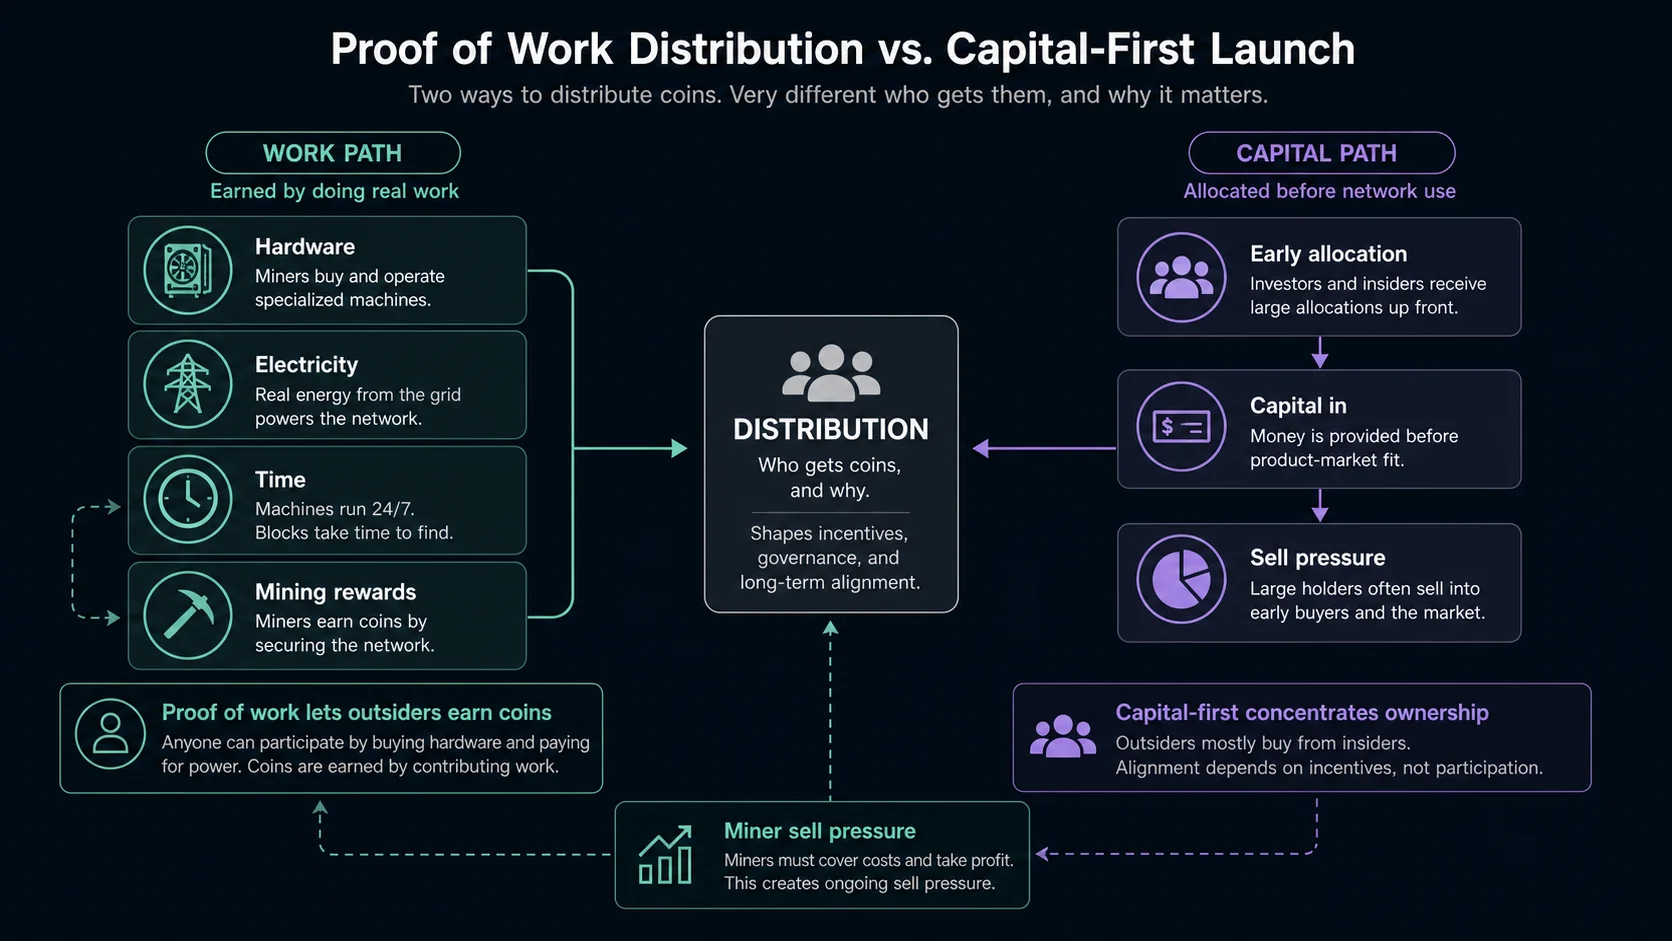
Kaspa's fast emission schedule is part of the hard-money thesis. The supply moves toward its cap quickly. The same design also front-loads distribution pressure.
Early miners and early participants got coins by showing up and doing the work. That fits the fair-launch story. It also means the early market has to absorb coins moving from early miners and early holders into later buyers. Some people take profit. Some miners sell to cover costs. Some holders panic. Some people accumulate. Distribution can look noble in a white paper and ugly on a chart.
People usually talk about conviction as holding through the downside. The upside is a test too. Rallies tempt profit-taking. Drawdowns test whether anyone actually believes the thing. Both directions move coins from one kind of holder to another.
Open the fairness-and-violence tradeoff
Fast proof-of-work emissions can distribute coins without selling a giant insider allocation first. That is the fairness part.
The same speed can make the first cycle violent. Coins move from miners and early holders into later buyers quickly, and some of those people need cash. Fair launch does not mean gentle markets.
Perspective checks
Some arguments sound scarier or cleaner than they are because people use the wrong lens. Linear charts, market cap, total supply, and hash rate all tell part of the story. Each one leaves something important out.
Go deeper: linear charts hide the thing people actually care about
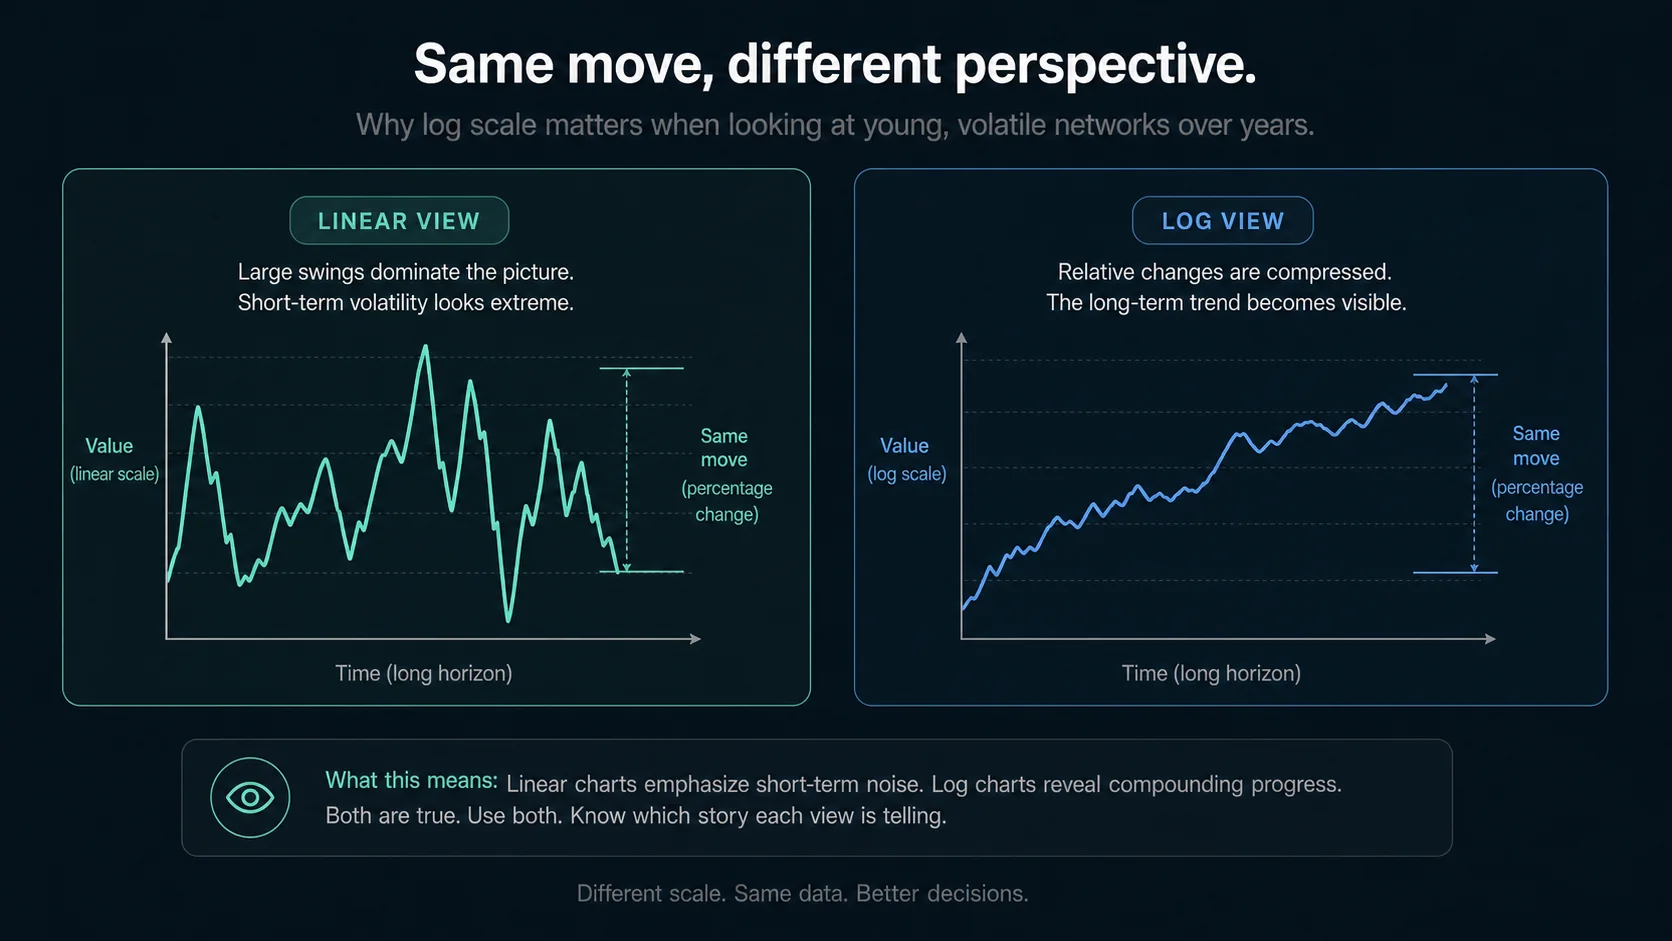
People talk in dollars, but they usually care about multiples. A move from $10 to $20 and a move from $10,000 to $20,000 are both 2x. The dollar amounts feel different. The investment effect is the same percentage move.
Log scale fits young networks better. A linear chart makes the latest dollar swing dominate the page. A log chart shows proportional moves across time. On a linear chart, an 80% drawdown can look like death. On a log chart, it can look like one violent move inside a much larger compounding path.
How it fools you: your eye sees distance, but your portfolio feels percentage change.
That does not make drawdowns fake. It explains why two people can look at the same chart and feel different things. A top buyer sees loss. An early holder may see a brutal drawdown from absurd gains. Someone who bought near the beginning and still holds may be living through pain and life-changing profit at the same time. Both are real.
Go deeper: market cap is not a pile of cash
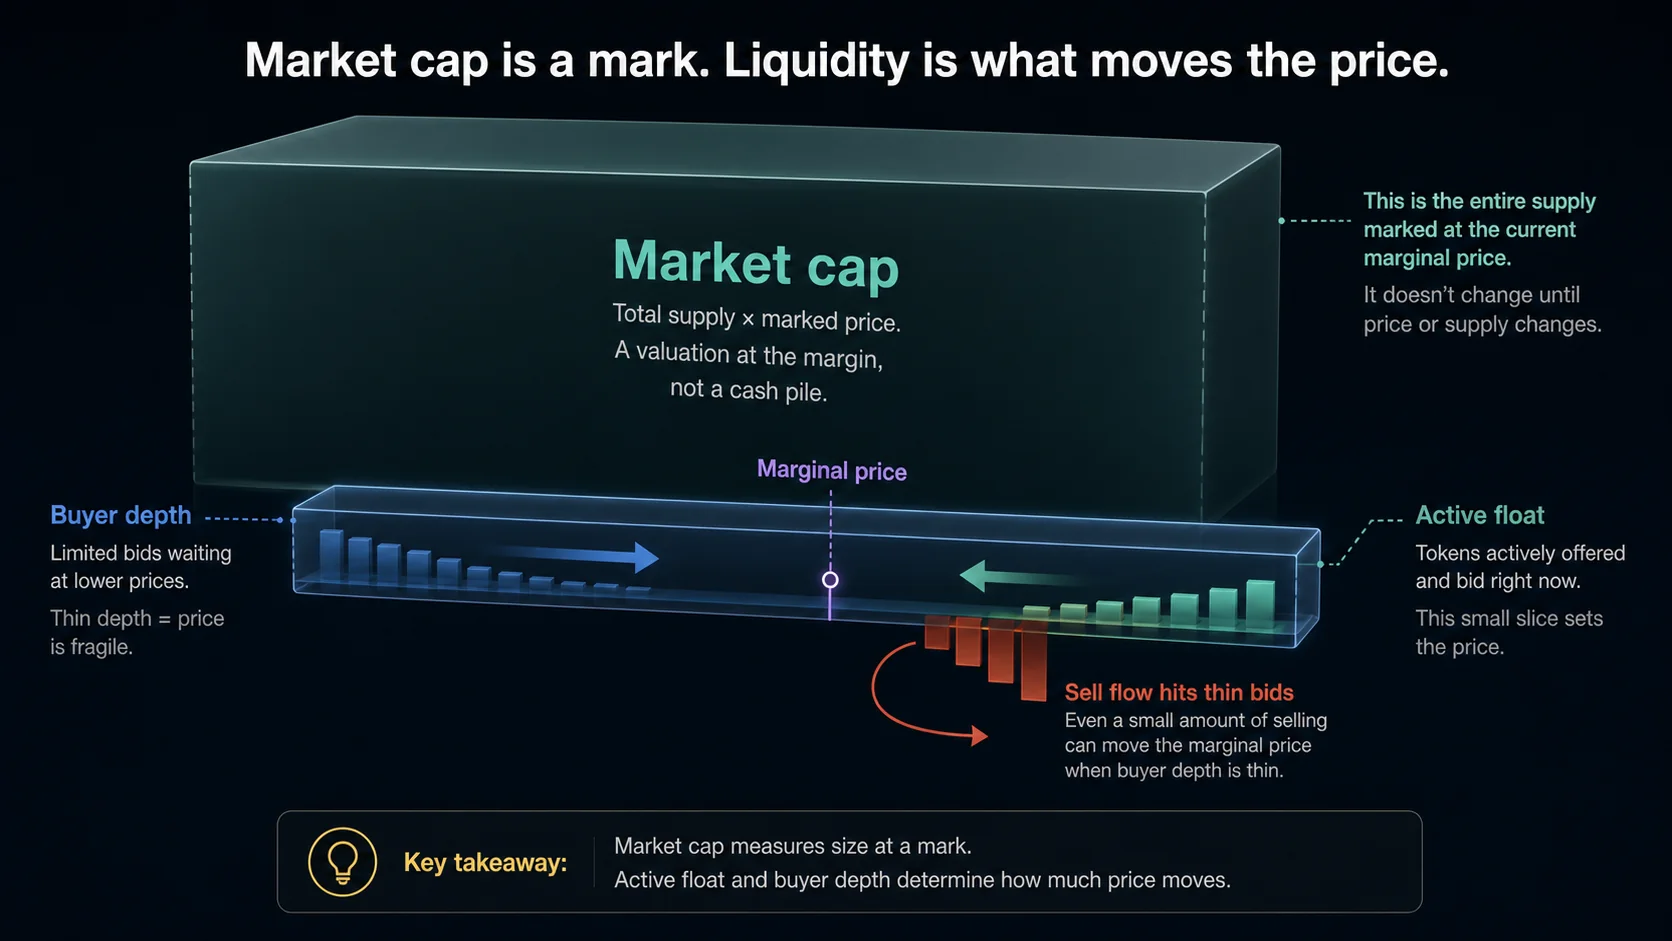
Market cap is total supply marked at the marginal price. It is not a cash pile sitting somewhere.
If price falls 20%, sellers did not necessarily extract 20% of the market cap in cash. Sometimes a small amount of selling moves price a lot because buyers step away. Sometimes a liquidation moves coins into market inventory, and the market spends weeks or months absorbing them. Sometimes sellers keep leaning on the book because they need liquidity before they need conviction.
How it fools you: market cap looks like a pool of money, but price is set at the edge where the next buyer meets the next seller.
Float sets the selloff pressure. The question is how many coins are actively for sale, how urgent those sellers are, and how deep the buyers are at each price. Total supply matters for the monetary story. Active float matters in a selloff.
October 10 belongs in that category. A large liquidation event can change the market even after the candle is over because coins move from one kind of holder into another kind of inventory. The exact wallet-level story needs hard sourcing before naming names. The mechanism is still worth understanding.
Go deeper: miners do not get to be pure believers
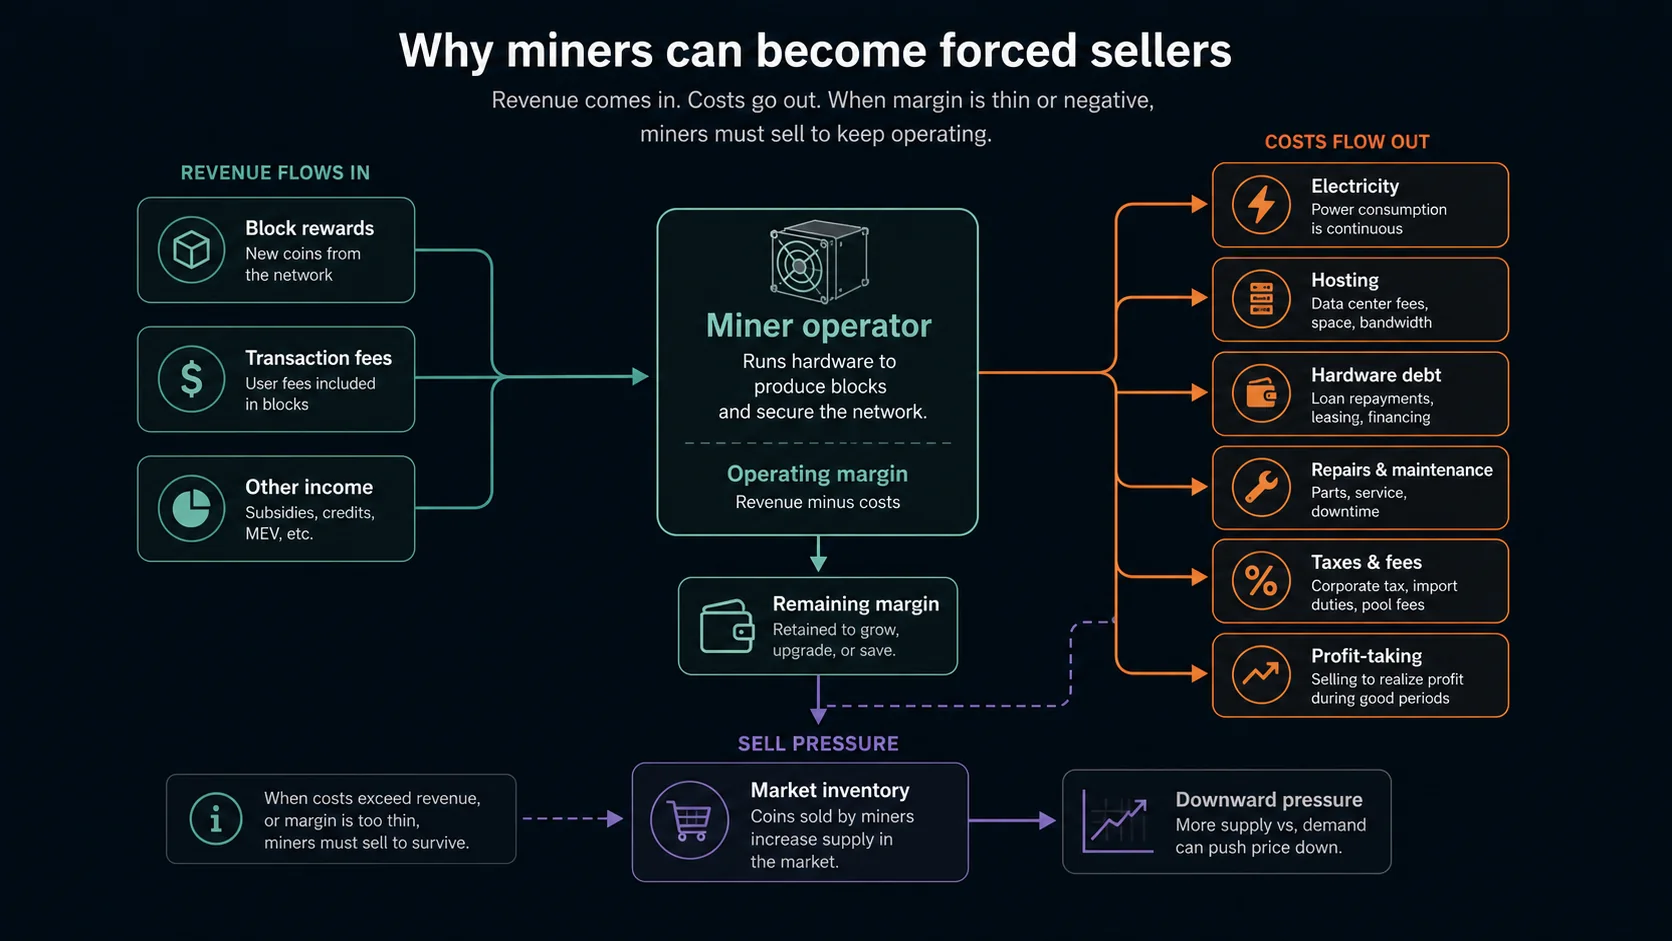
Holders can decide to sit still. Miners have bills. Electricity, hosting, hardware debt, repairs, taxes, pool fees, and upgrades all turn into cash needs. If margins are thin, miners can become sellers even when they like the network.
Mining was extremely attractive when price outran hash rate. ASICs were expensive because the revenue opportunity was real. Some machines cost tens of thousands of dollars during the hot phase. Those operators had to recoup costs, and some of that recouping happens through selling coins.
How it fools you: conviction and selling can coexist. A miner can believe in Kaspa and still need dollars by Friday.
This is not a moral failure. It is proof-of-work mechanics. The same process that secures the network also creates a real business cycle.
Judging the charts
Price down and hash rate down can mean several things
| Signal | Too-fast reading | Slower reading |
|---|---|---|
| Price down | The market lost interest. | Could be lost demand, miner selling, early-holder profit-taking, broad market weakness, leverage unwind, or all of them together. |
| Hash rate down | The network is failing. | Could be weaker security, or inefficient miners leaving after an overheated ASIC cycle. Compare against long-term history and attack cost. |
| Hash rate up while price falls | Security is fine, ignore price. | Could be delayed ASIC orders arriving into a weak market, raising difficulty and squeezing miner margins. |
| ASIC prices fall | Mining is dead. | Could be used-machine oversupply after manufacturers and miners overbuilt into a hot phase. |
| Fees rise | Higher fees are automatically good. | Fees help miners when they come from repeat use people value. Spam and one-off bursts are a weaker signal. |
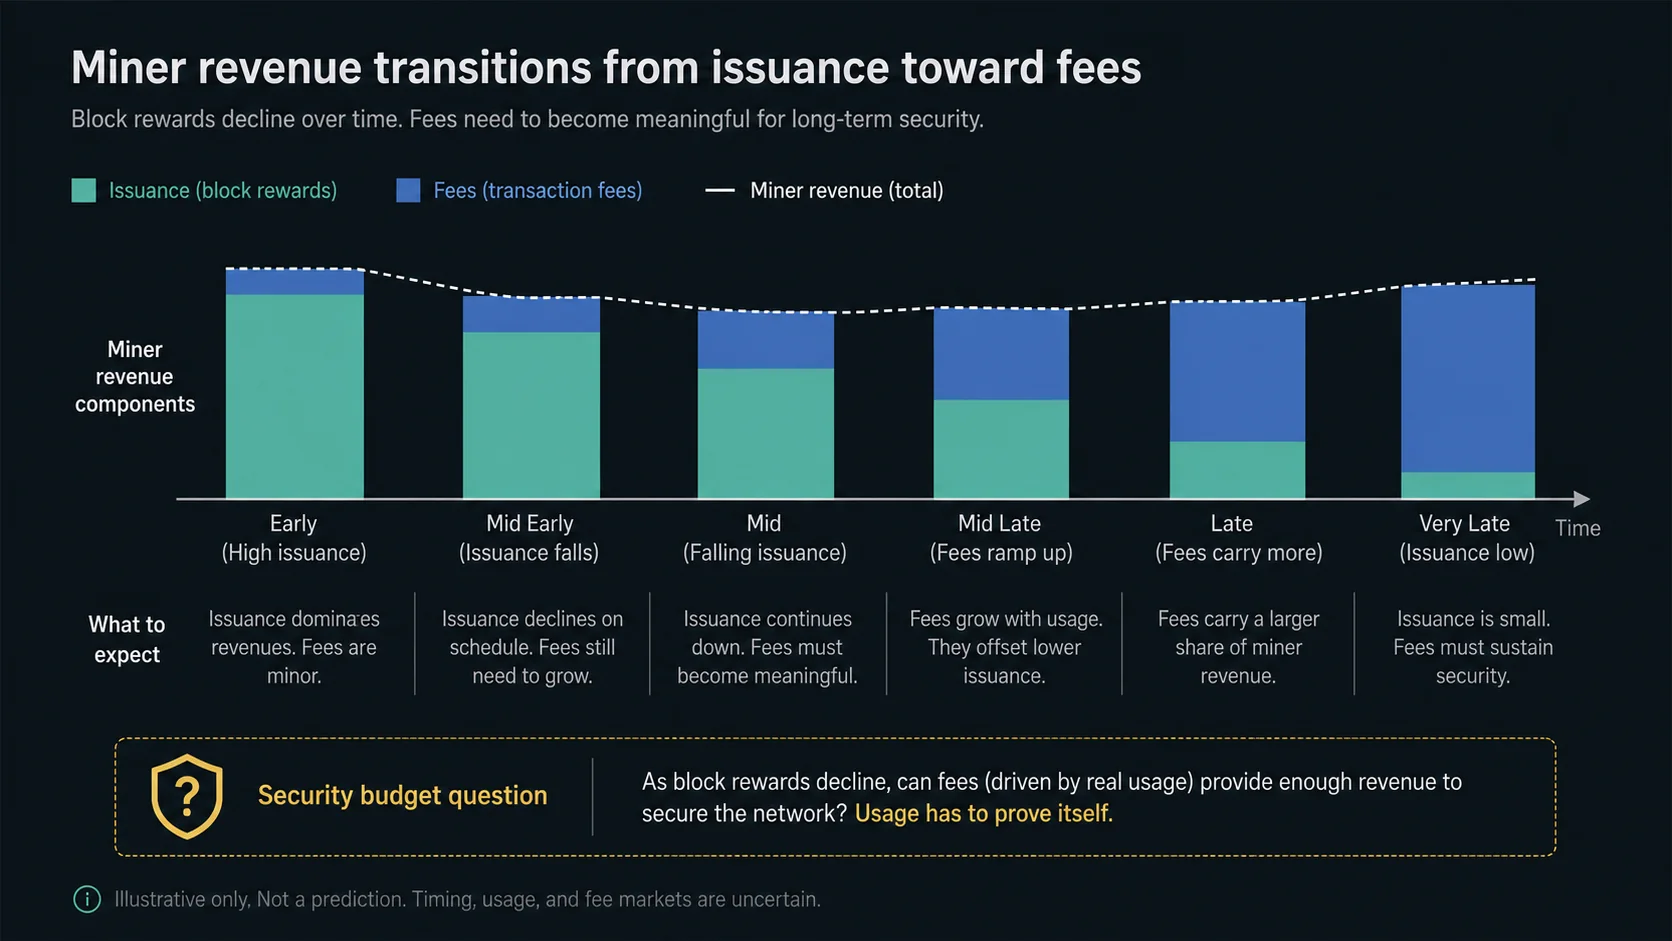
Fees are the second revenue source
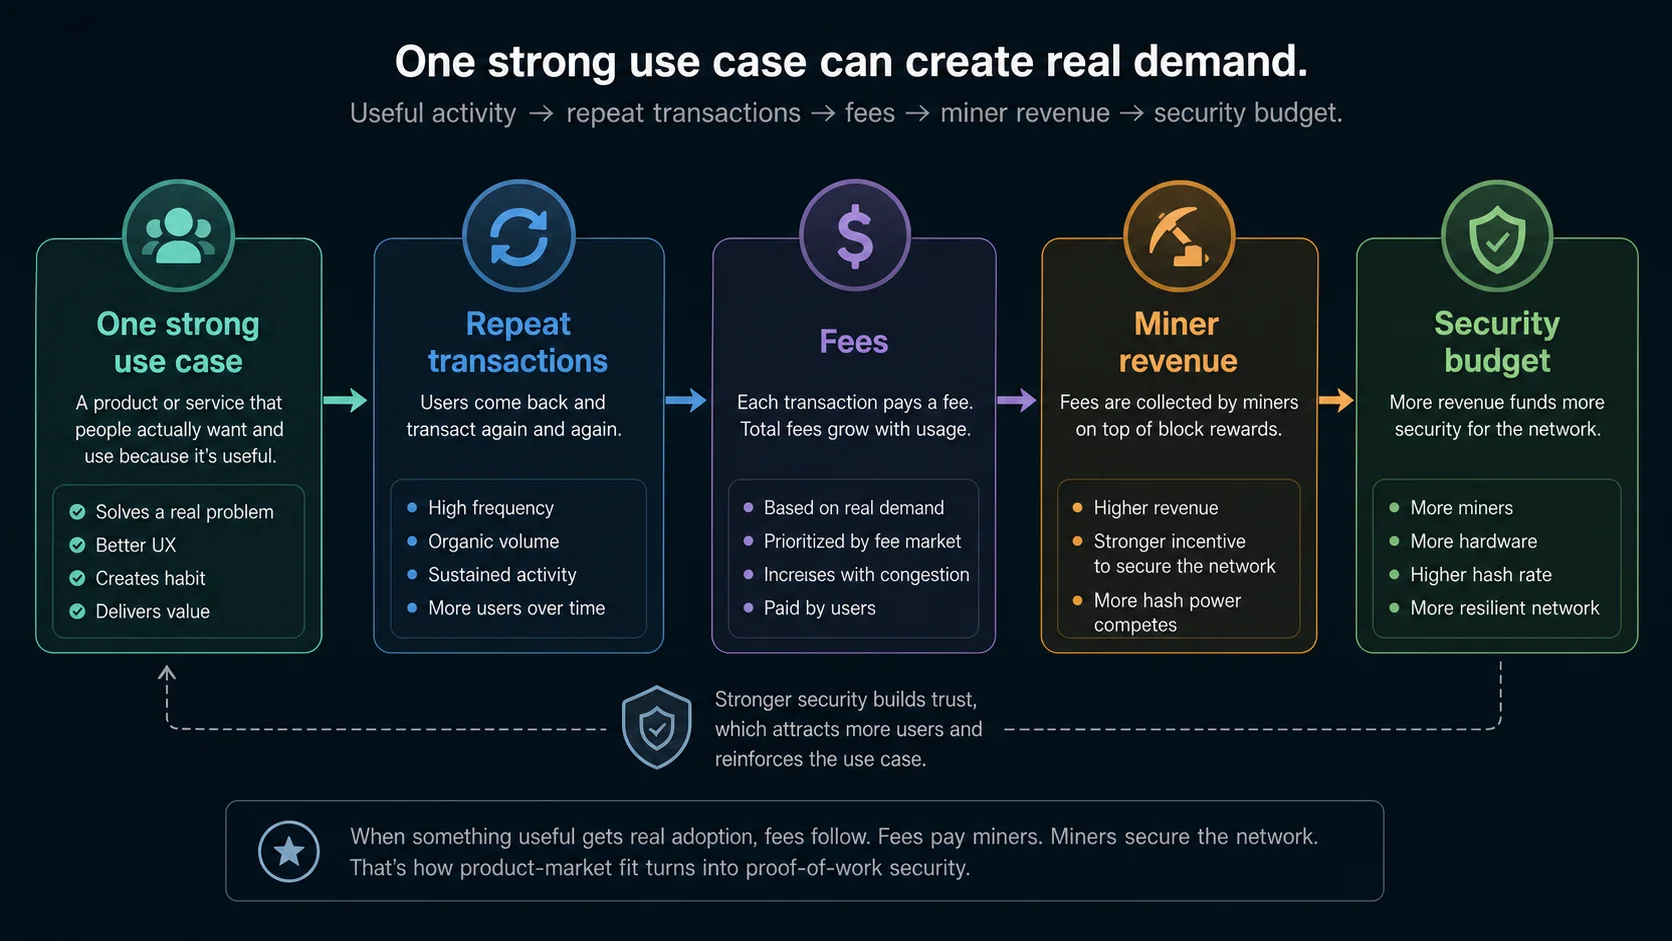
Issuance pays miners first. Fees have to matter later.
That is the security-budget question. As block rewards decline, miners eventually need meaningful revenue from transaction fees, coin value, or both. Toccata expands the design space: covenants, covenant IDs, ZK proof verification, sequencing commitments, and based-app foundations.
That still does not create usage by itself. The fee side needs real applications, real users, real transactions, and real demand for blockspace. Toccata gives builders primitives to test. The market still has to prove people want them.
One strong use case is enough to matter. It does not have to be every app, every user, every theory. If one thing creates repeat demand for settlement, ordering, proofs, assets, or payments, that use can reprice blockspace and make fees part of the security budget. The hard part is finding that use case. That is where the experiment is now.
Go deeper: why one use case can be enough
A network does not need to win every category to become valuable. It needs demand that repeats.
If one use case keeps producing transactions people are willing to pay for, miners get fee revenue, users need blockspace, and KAS gets pulled into that activity. That does not prove it will happen. It explains why the search for one serious use is enough to watch.
Visual shelf: fees and the second revenue source
Evidence
What would prove strength or weakness
Healthier
- Hash rate stabilizes or grows with better pool and operator distribution.
- ASIC ownership spreads through used markets and more independent operators.
- Wallets, explorers, SDKs, indexers, and solo-mining paths keep improving.
- Toccata creates repeat app use, accepted transactions, and fees miners care about.
- Liquidity improves without turning every claim into price worship.
Worse
- Hash rate keeps falling with worse mining concentration.
- Pool, manufacturer, firmware, hosting, or geography chokepoints get worse.
- Price, liquidity, and volume keep weakening without user demand replacing hype.
- Fees stay irrelevant because apps do not appear or do not retain users.
- Roadmap language outruns shipped product evidence.
Nobody knows live
- Whether this is healthy compression or a deeper failure phase.
- How much selling came from miners versus early holders versus broader market flows.
- Whether future fees can replace enough issuance as rewards decline.
- Whether a future research path such as Proof of Useful Work ever becomes real.
- Whether the next major cycle is up, down, sideways, or stranger than expected.
The bottom line
Kaspa can be in a healthy compression phase, or it can be in a deeper failure phase. You do not know in real time. Anyone pretending to know is selling certainty crypto does not give you.
The useful move is to watch the whole machine: price, liquidity, hash rate, ASIC prices, pool distribution, miner revenue, emissions, fees, builder activity, and usage. A price chart is too narrow. A hash-rate chart is too narrow. Together, with the ASIC cycle and fee question, they tell you what kind of proof-of-work network you are actually looking at.
Sources
Source notes
| Source | Used for |
|---|---|
| Kaspa public API: blockDAG state | July 1, 2026 mainnet DAA and network read. |
| Kaspa public API: coin supply and block reward | Dated supply and reward panel. |
| 2Miners Kaspa network hash-rate chart | Dated current hash-rate estimate. |
| Kaspa wiki timeline | Early hash-rate milestones: 60 MH/s in November 2021, 10 TH/s in June 2022, 50 TH/s in August 2022, and 500 TH/s in November 2022. |
| Kaspa wiki tokenomics | Fair-launch and no-premine context. |
| Coinbase Kaspa price page | All-time-high reference and market-data context. |
| CoinGecko Kaspa page and CoinGecko API | Dated current price read. |
Community cycle framing is credited to @Themooseisloos5. X posts shaped the explanatory model. Price, hash-rate, supply, and protocol-status claims use the sources listed above.