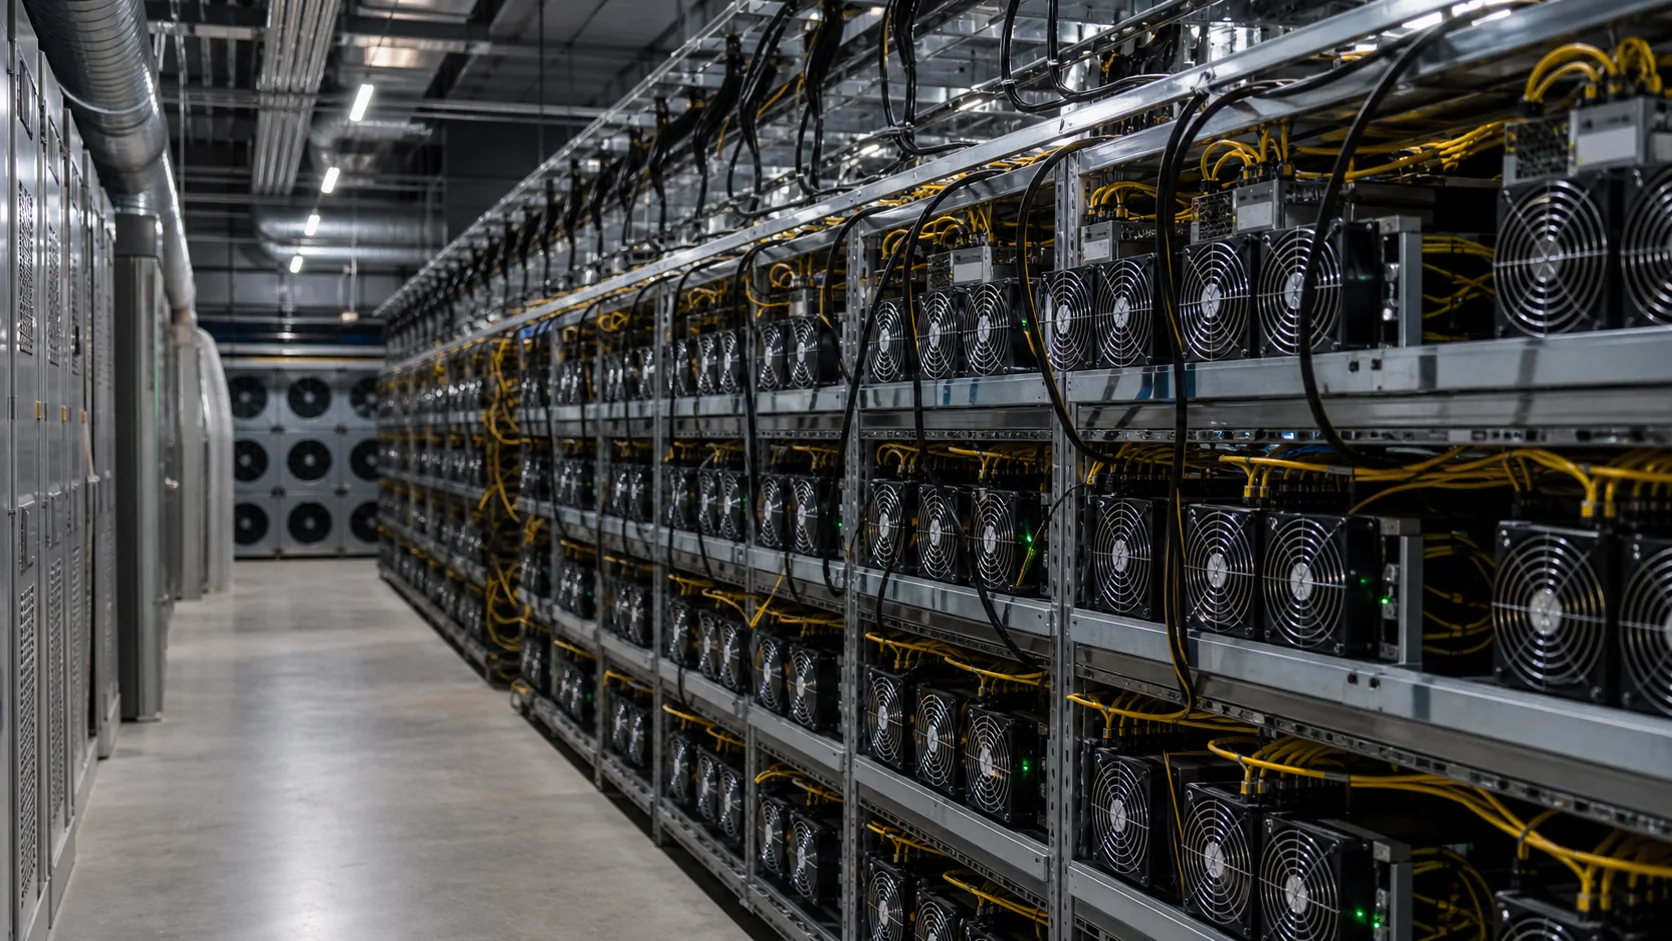
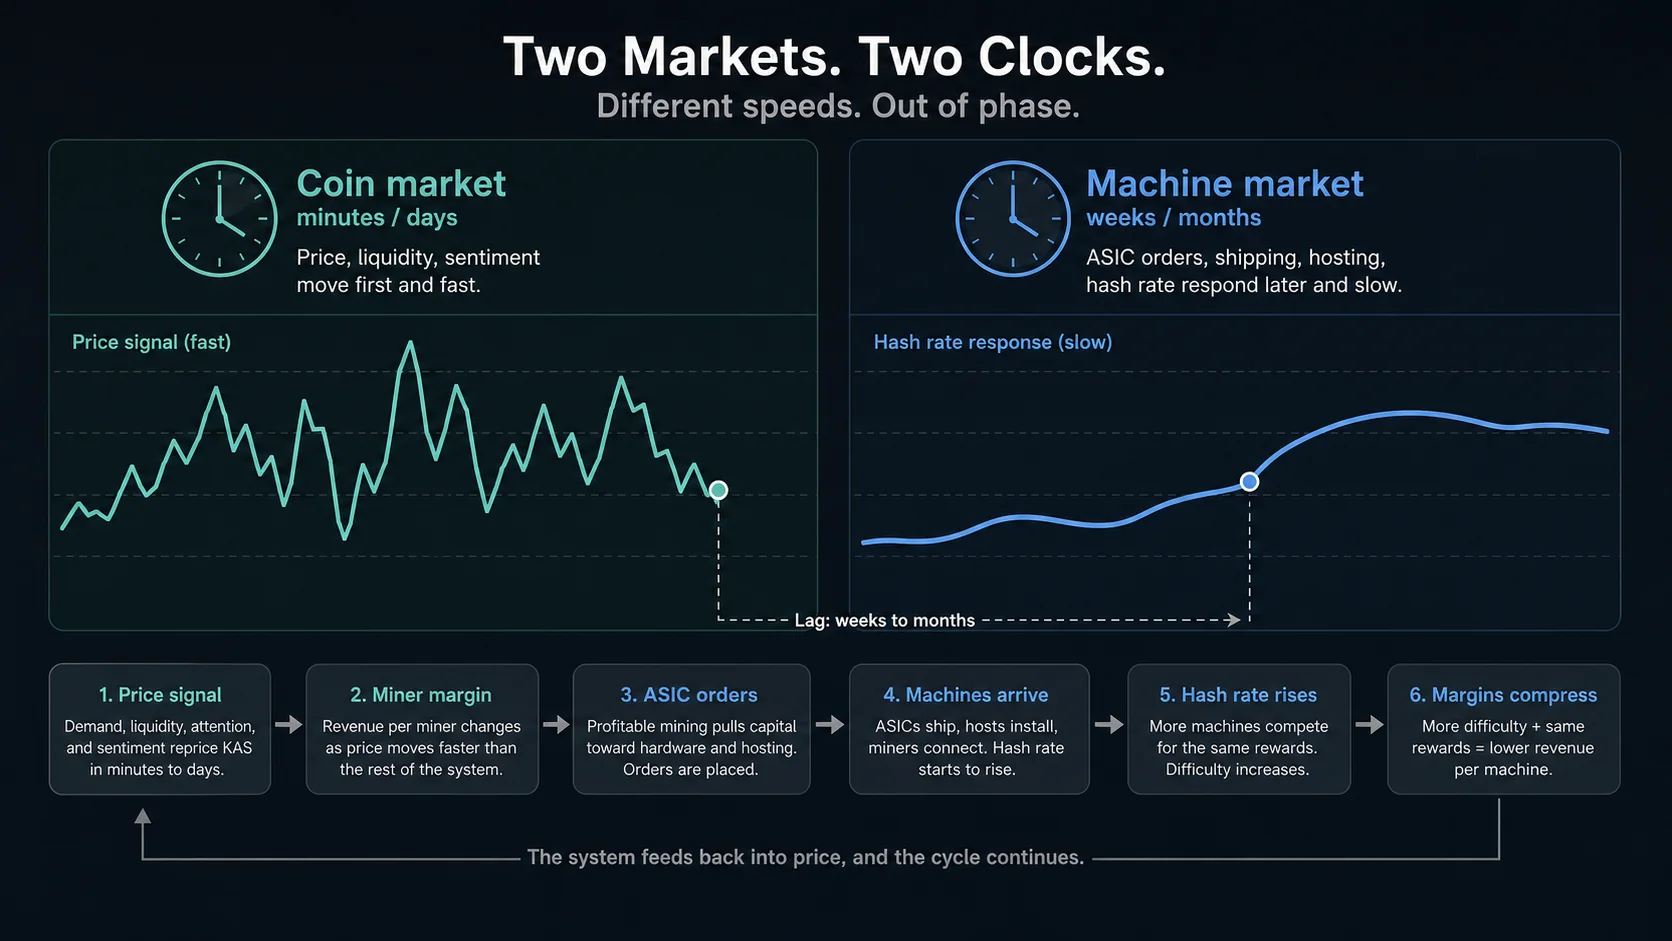
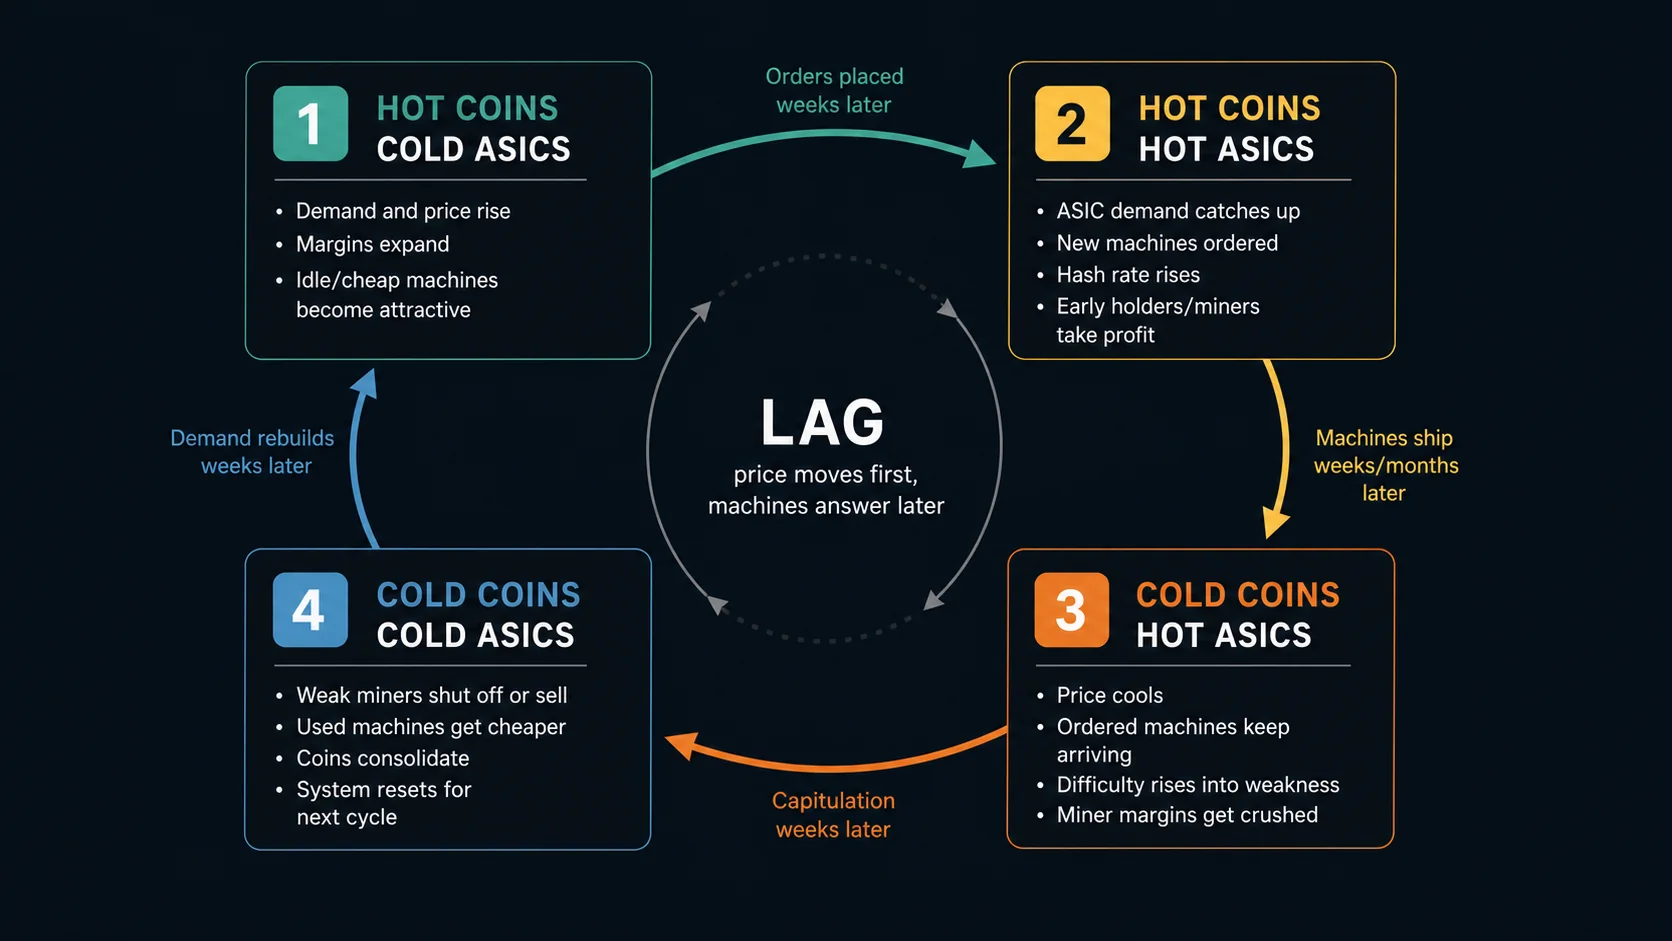
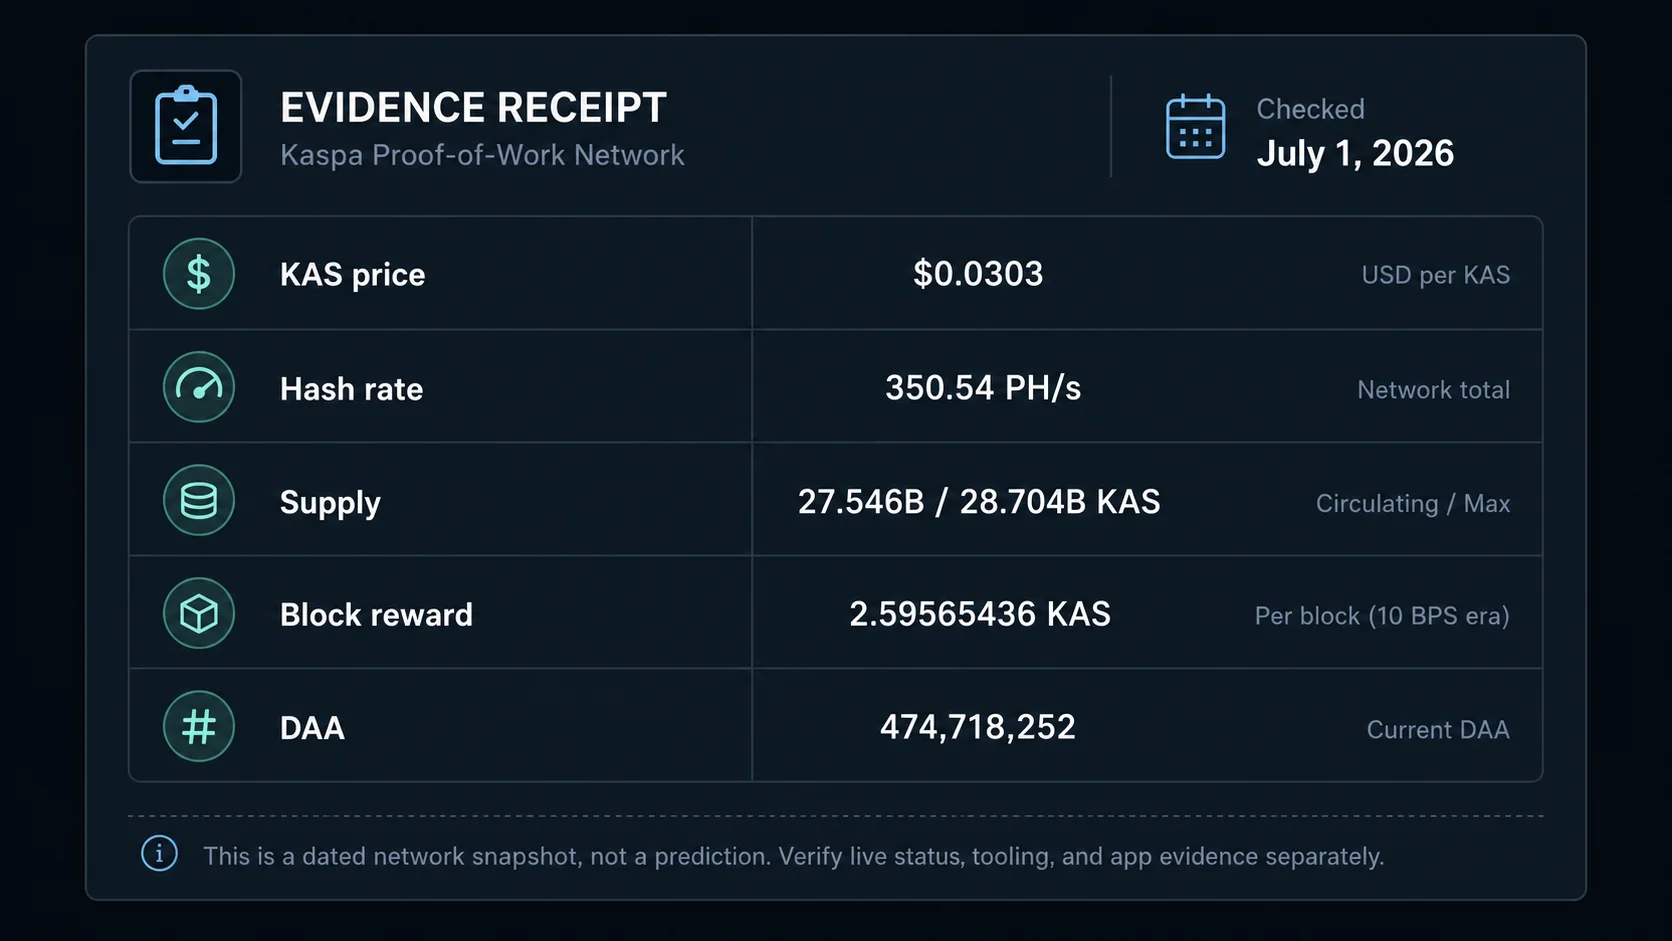
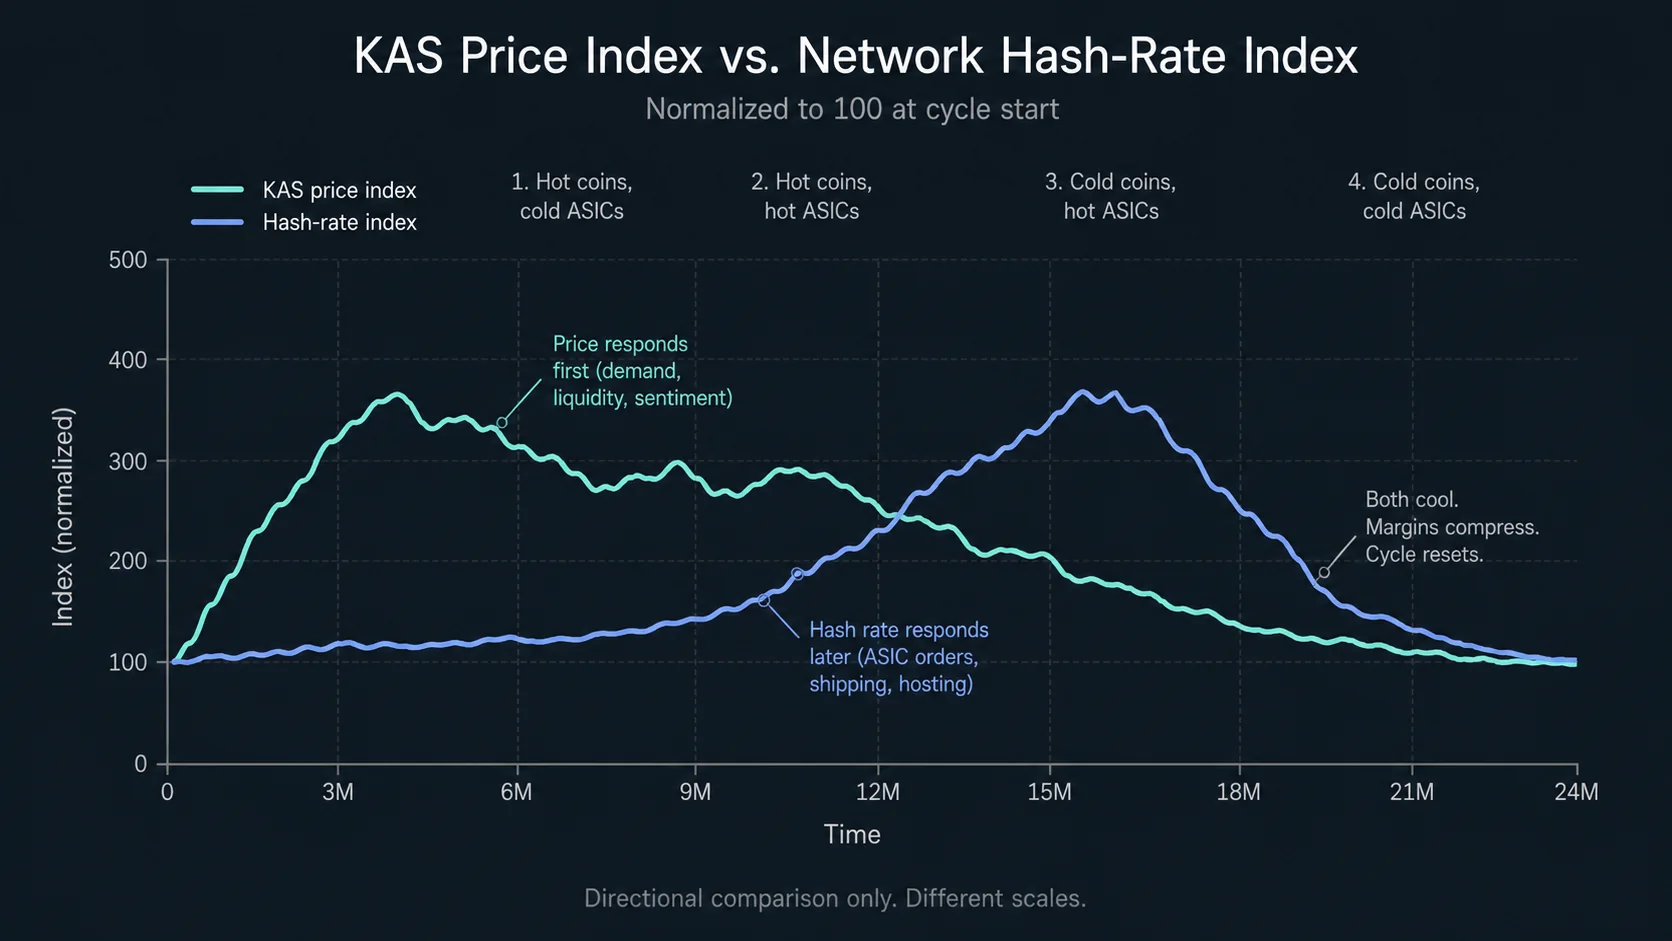
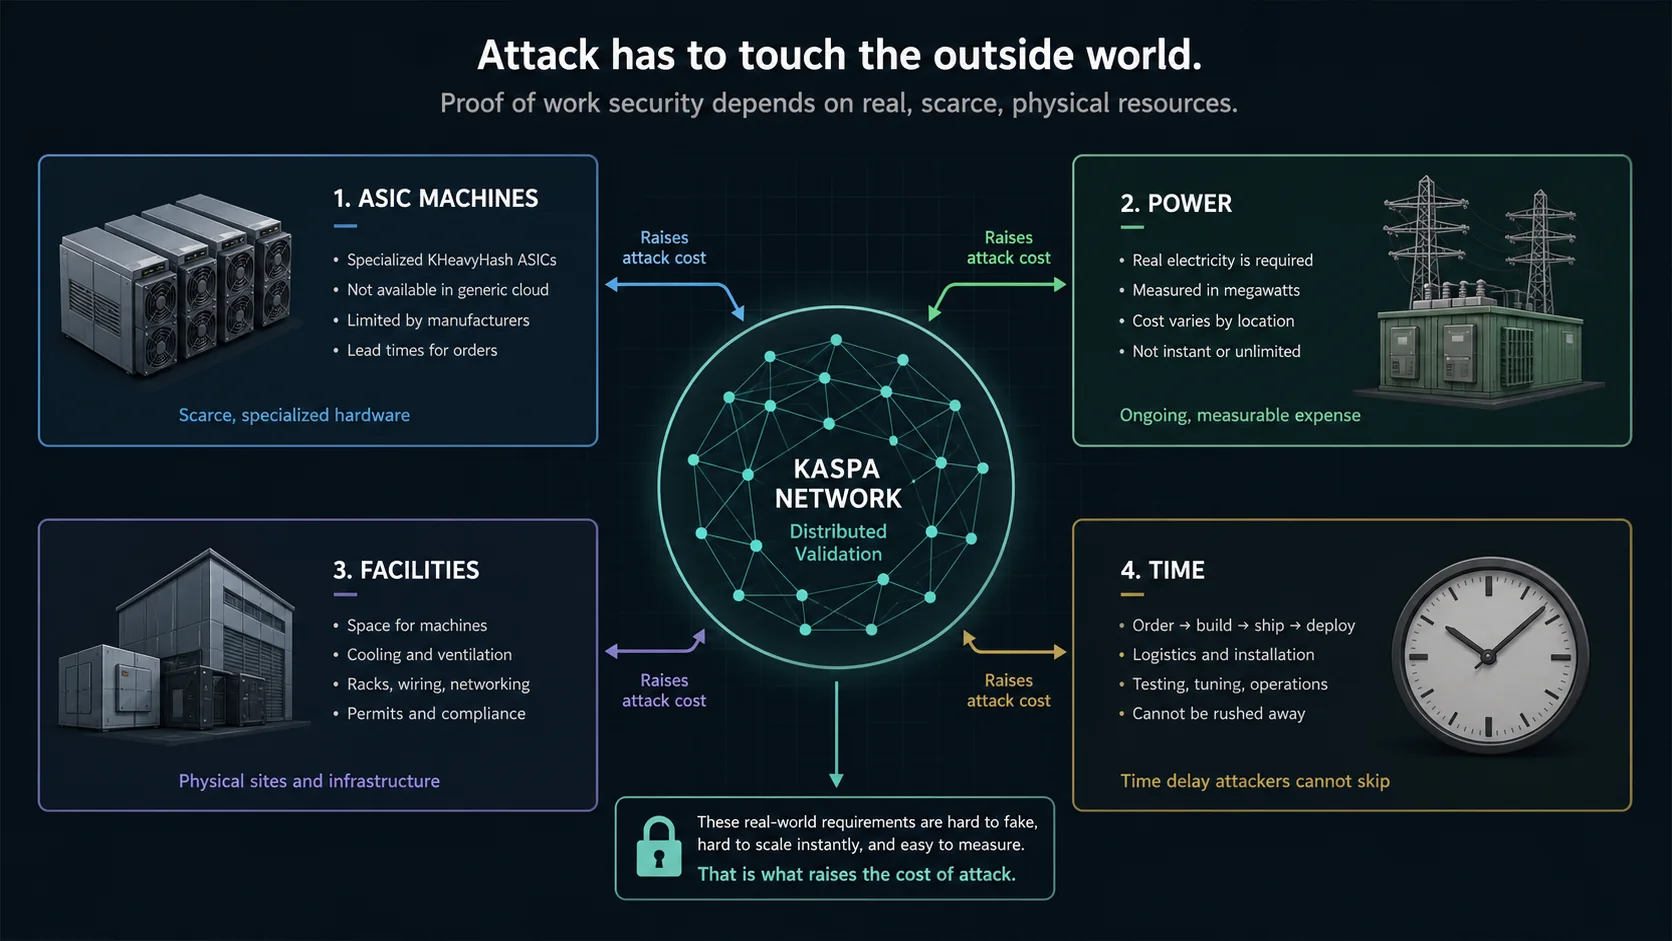
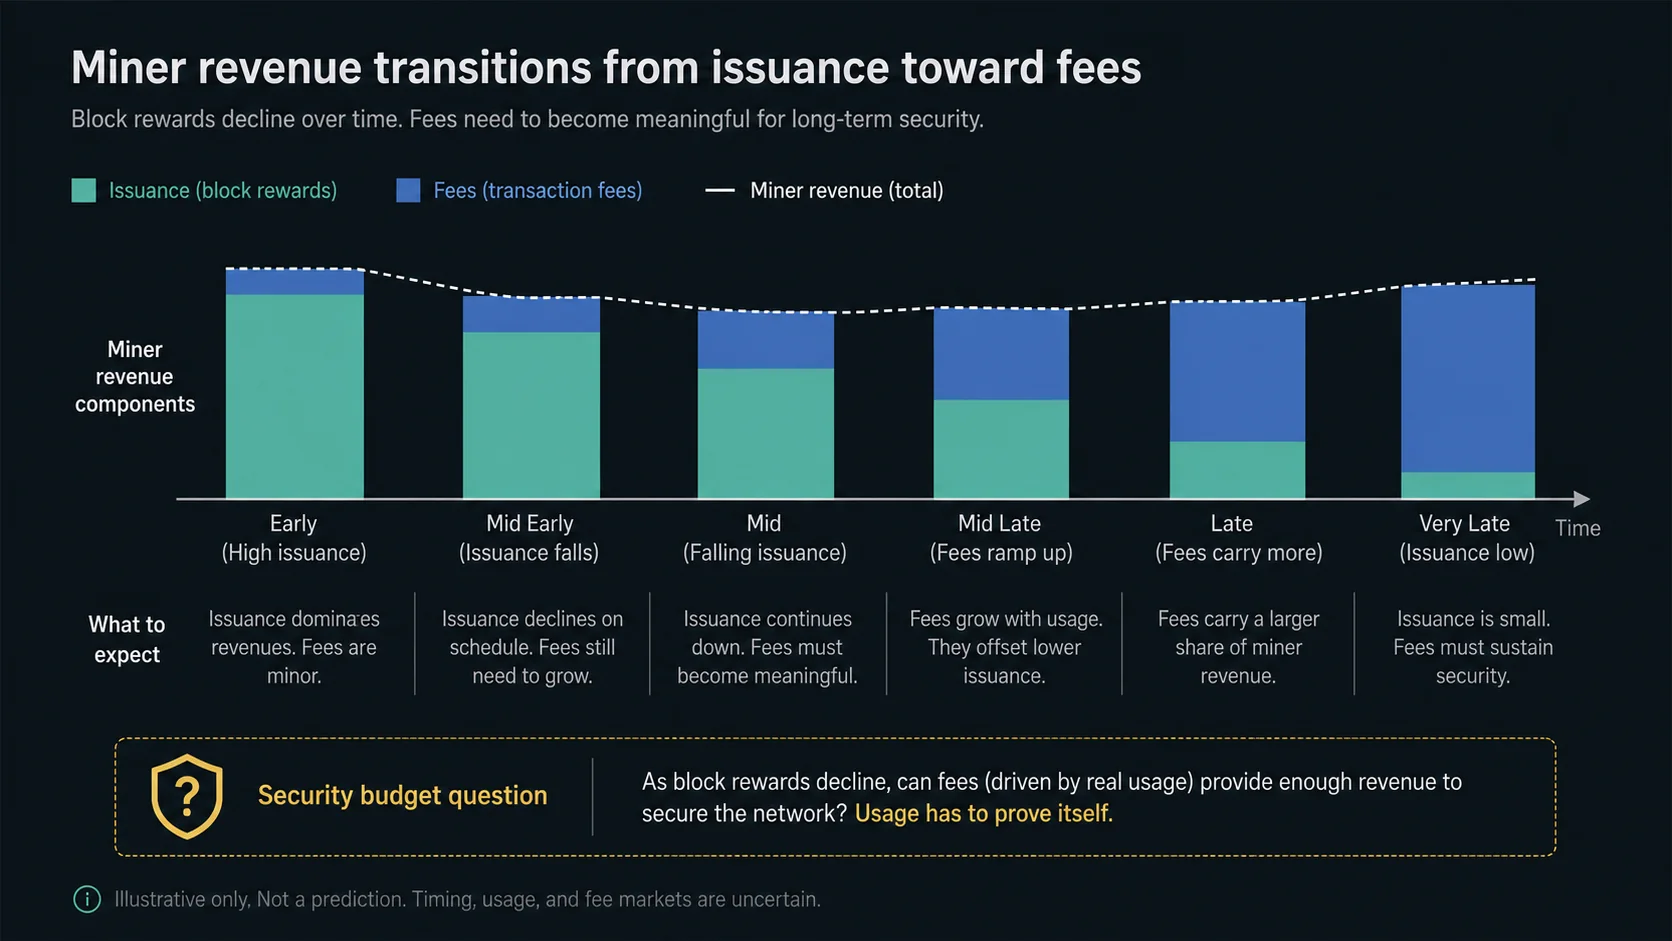
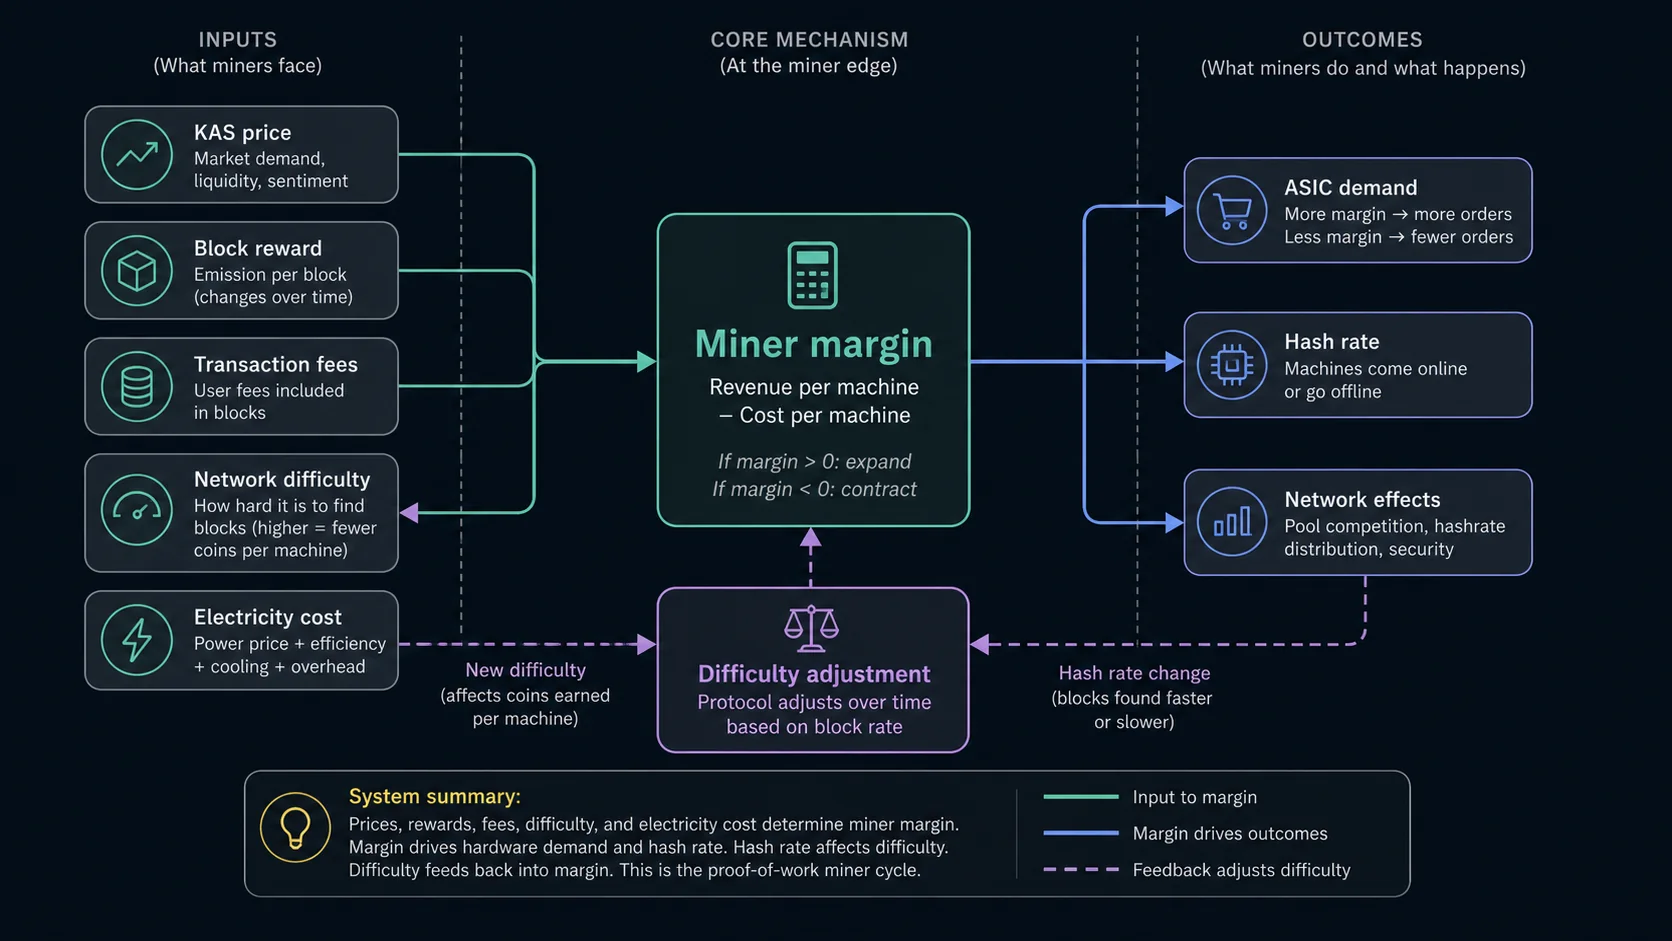
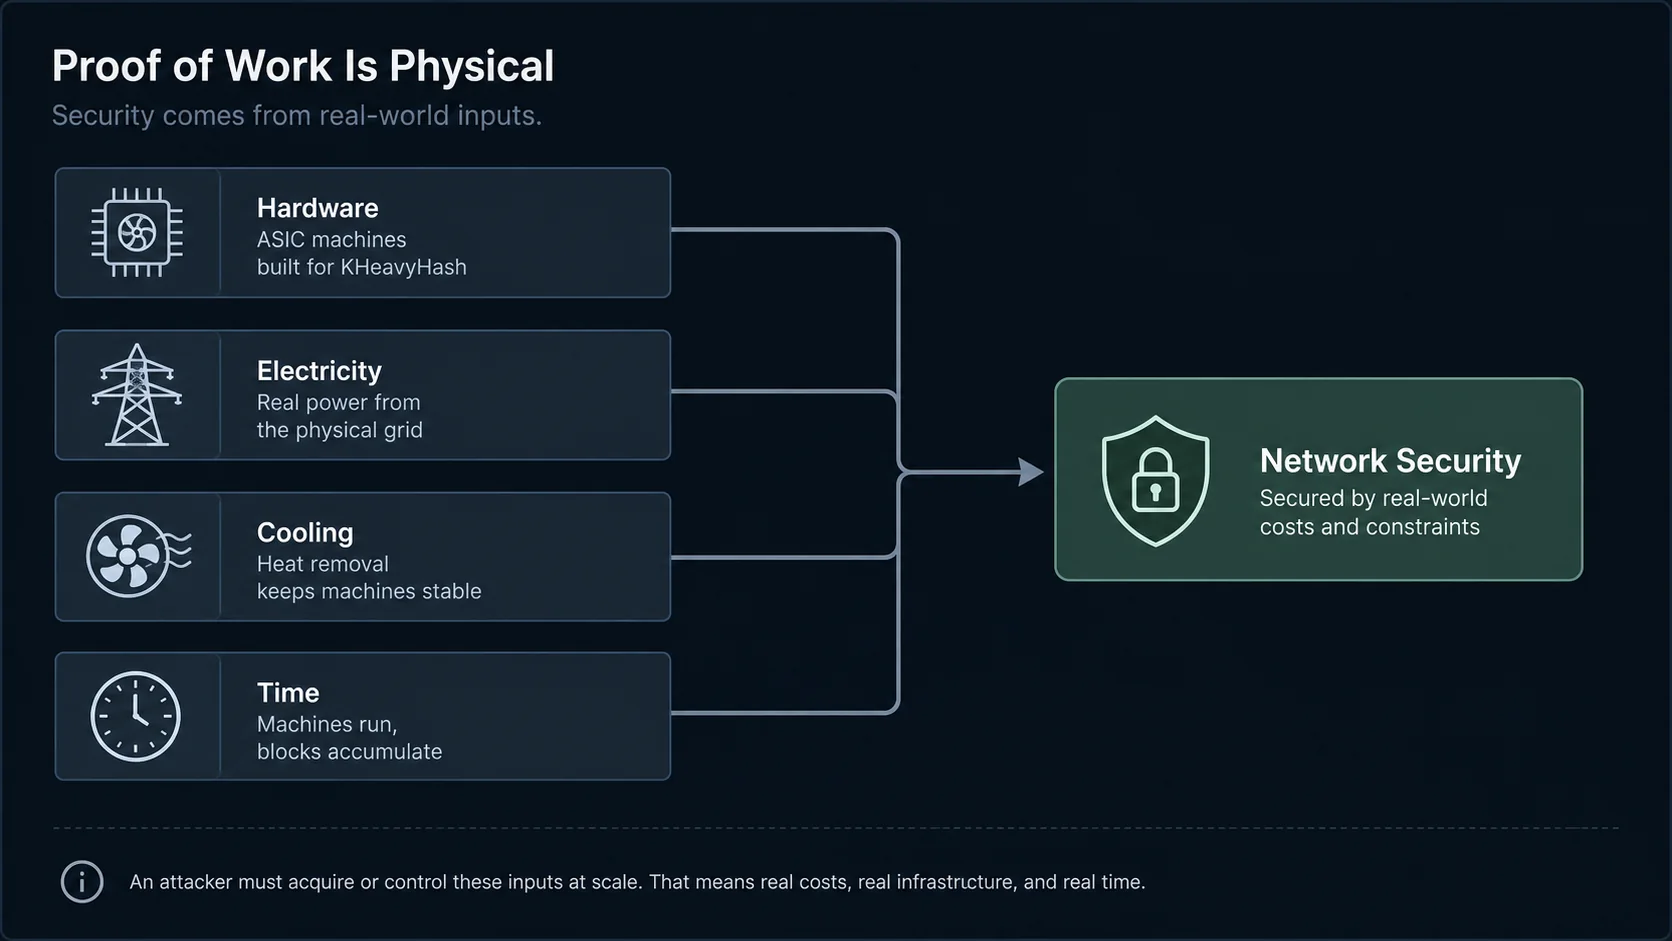
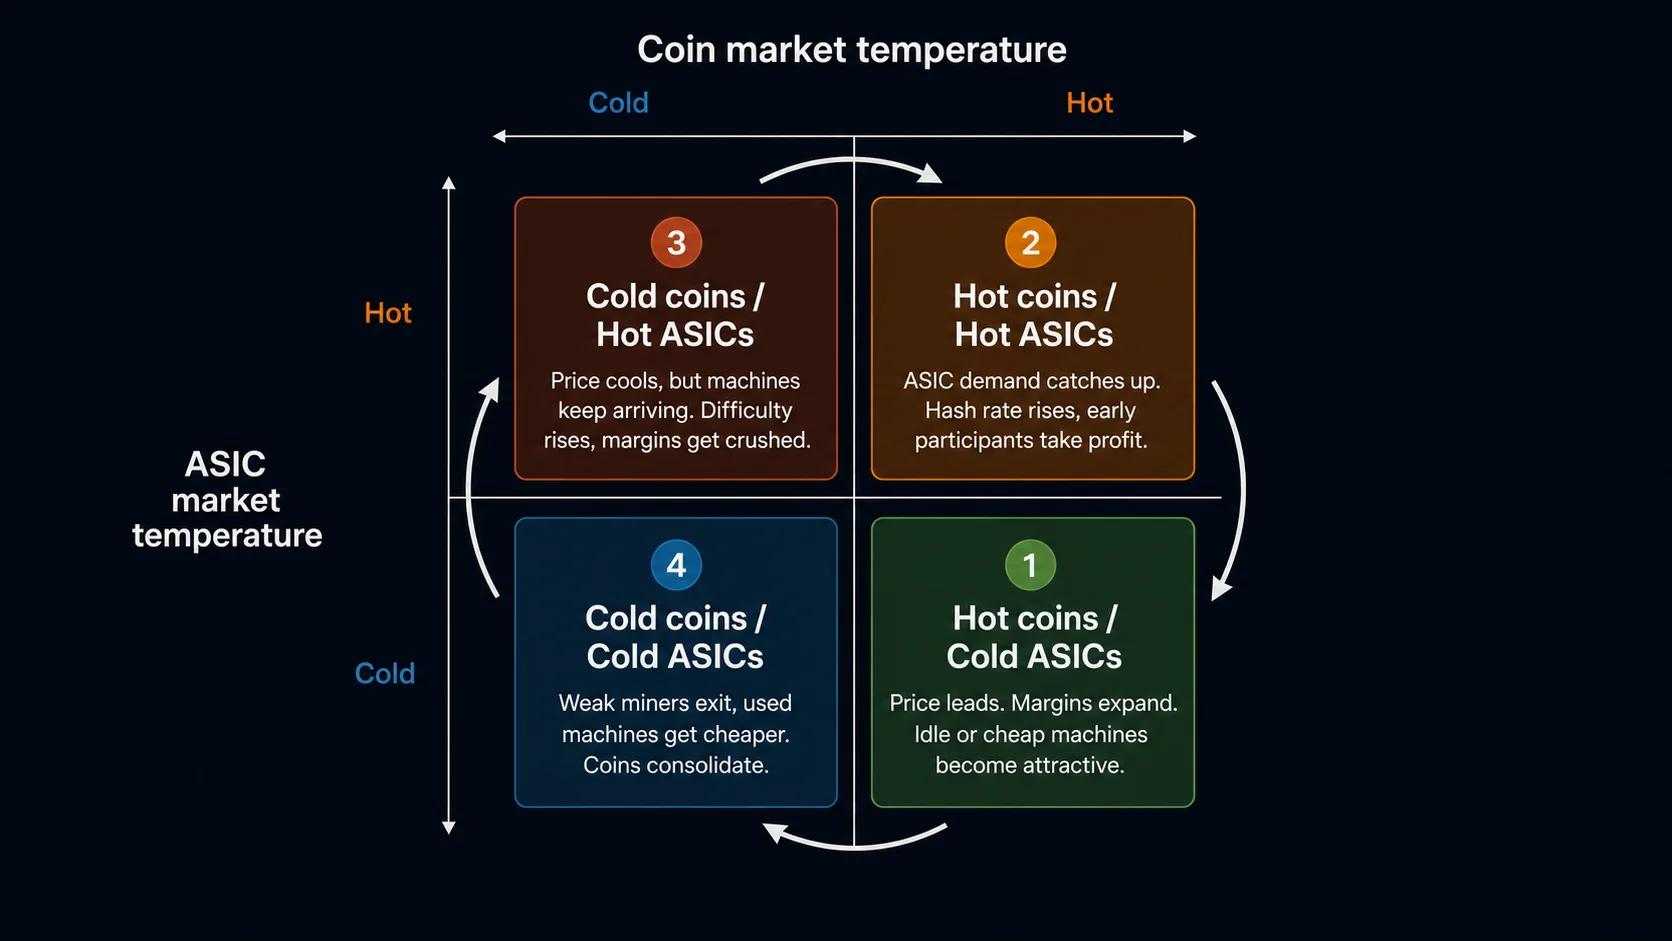
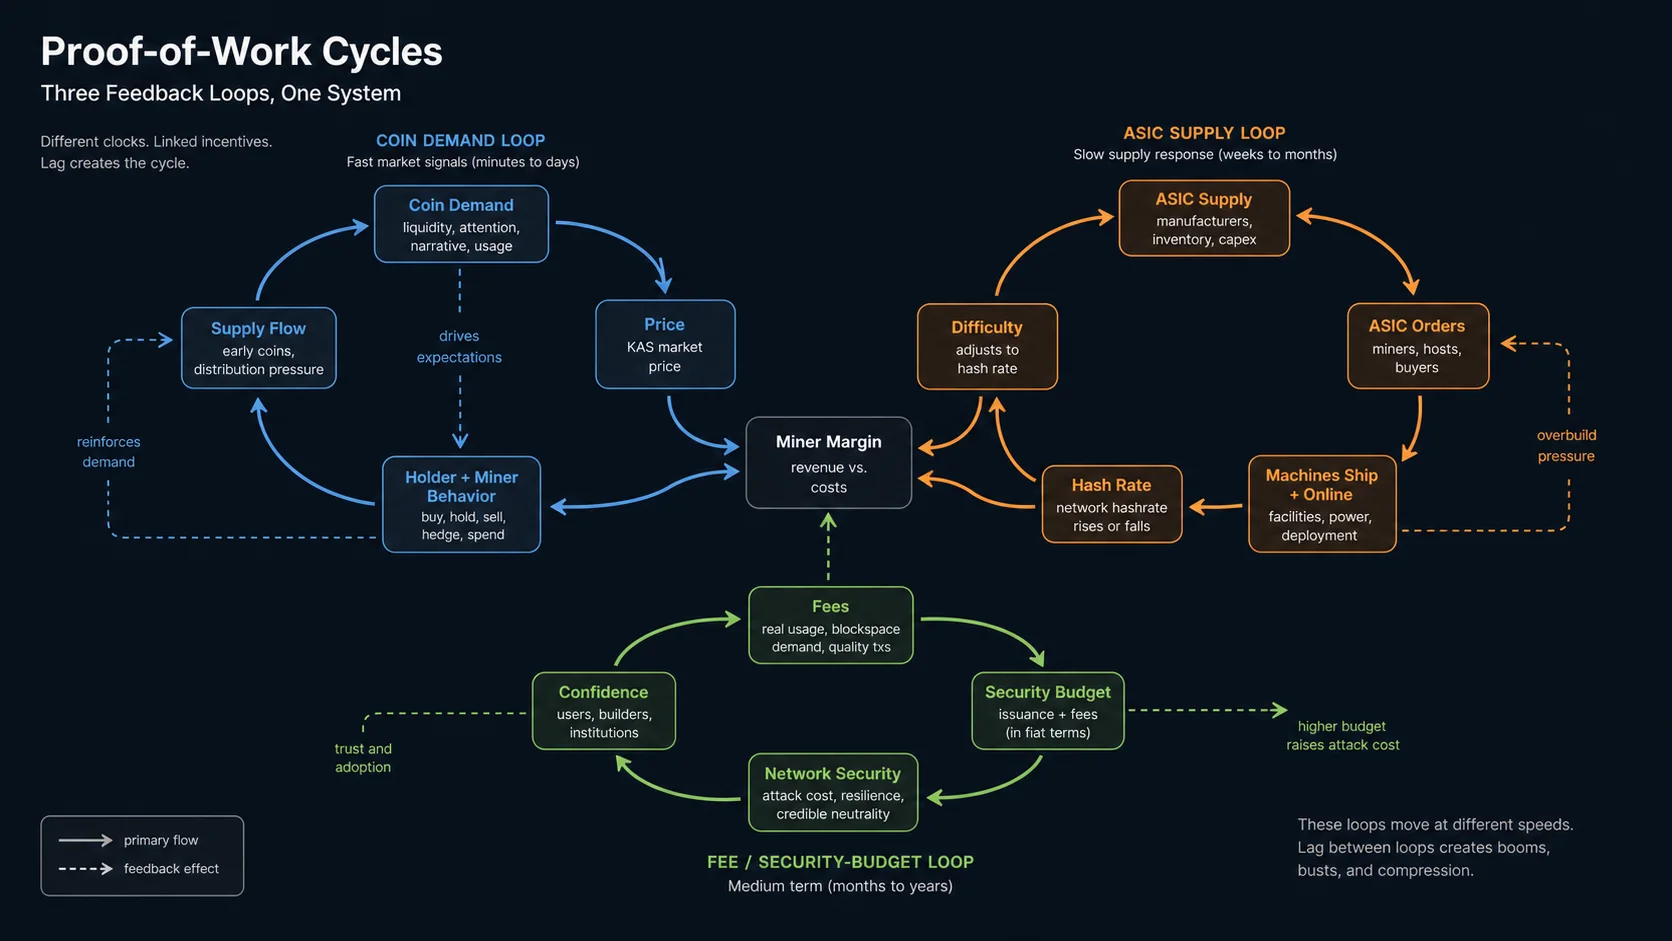
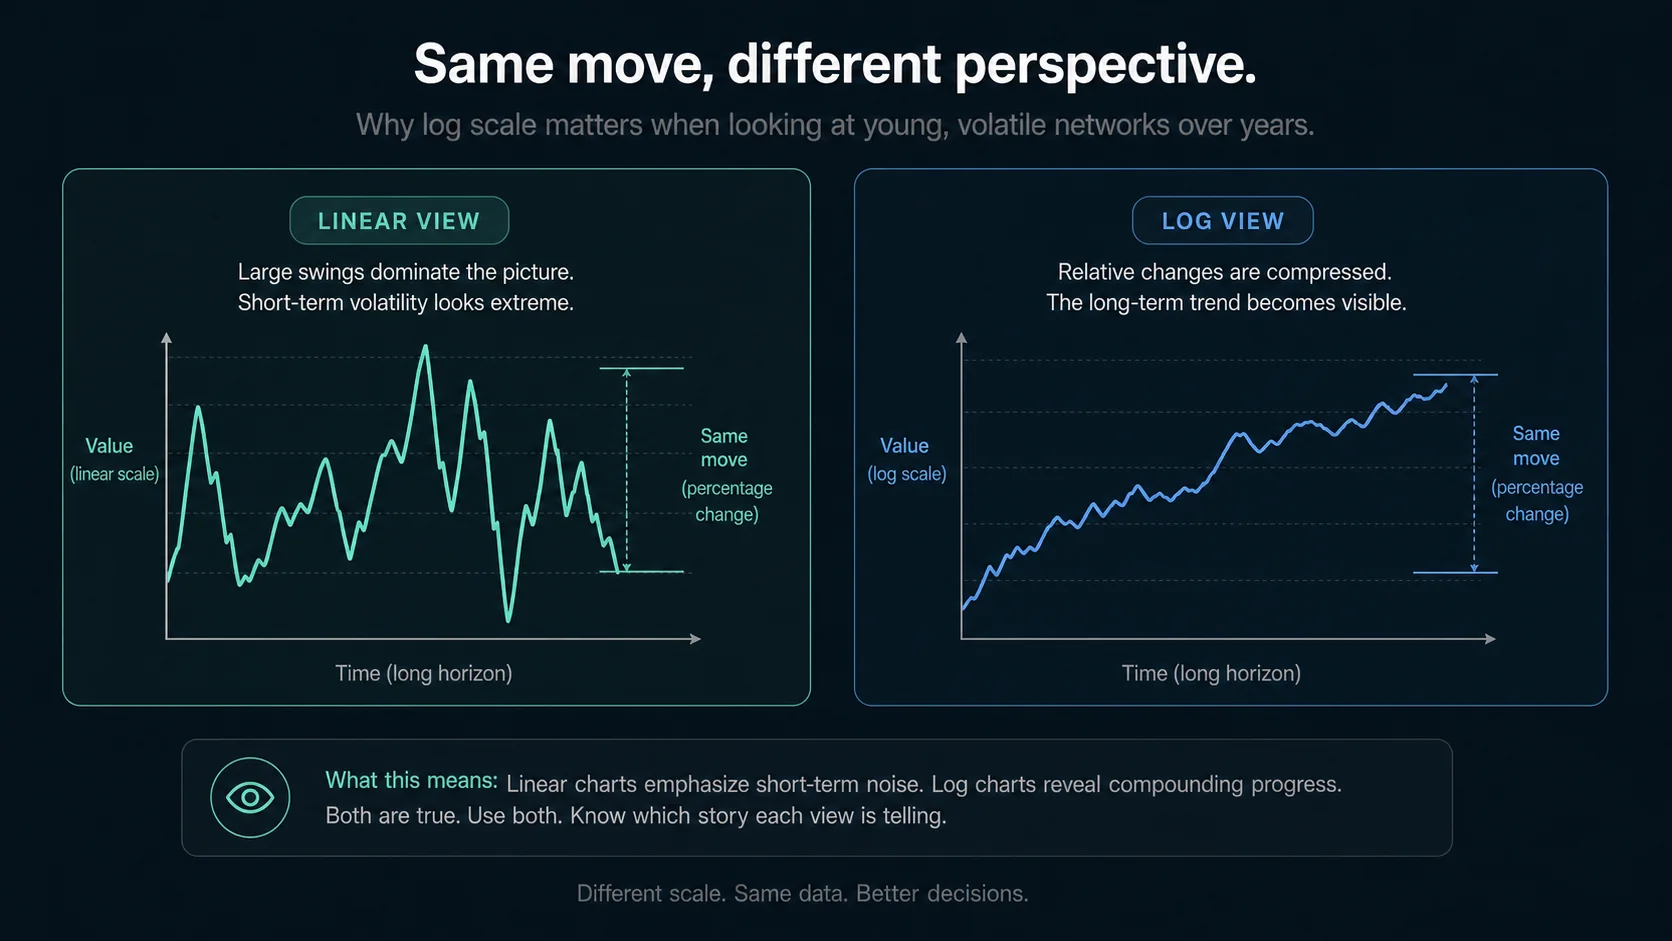
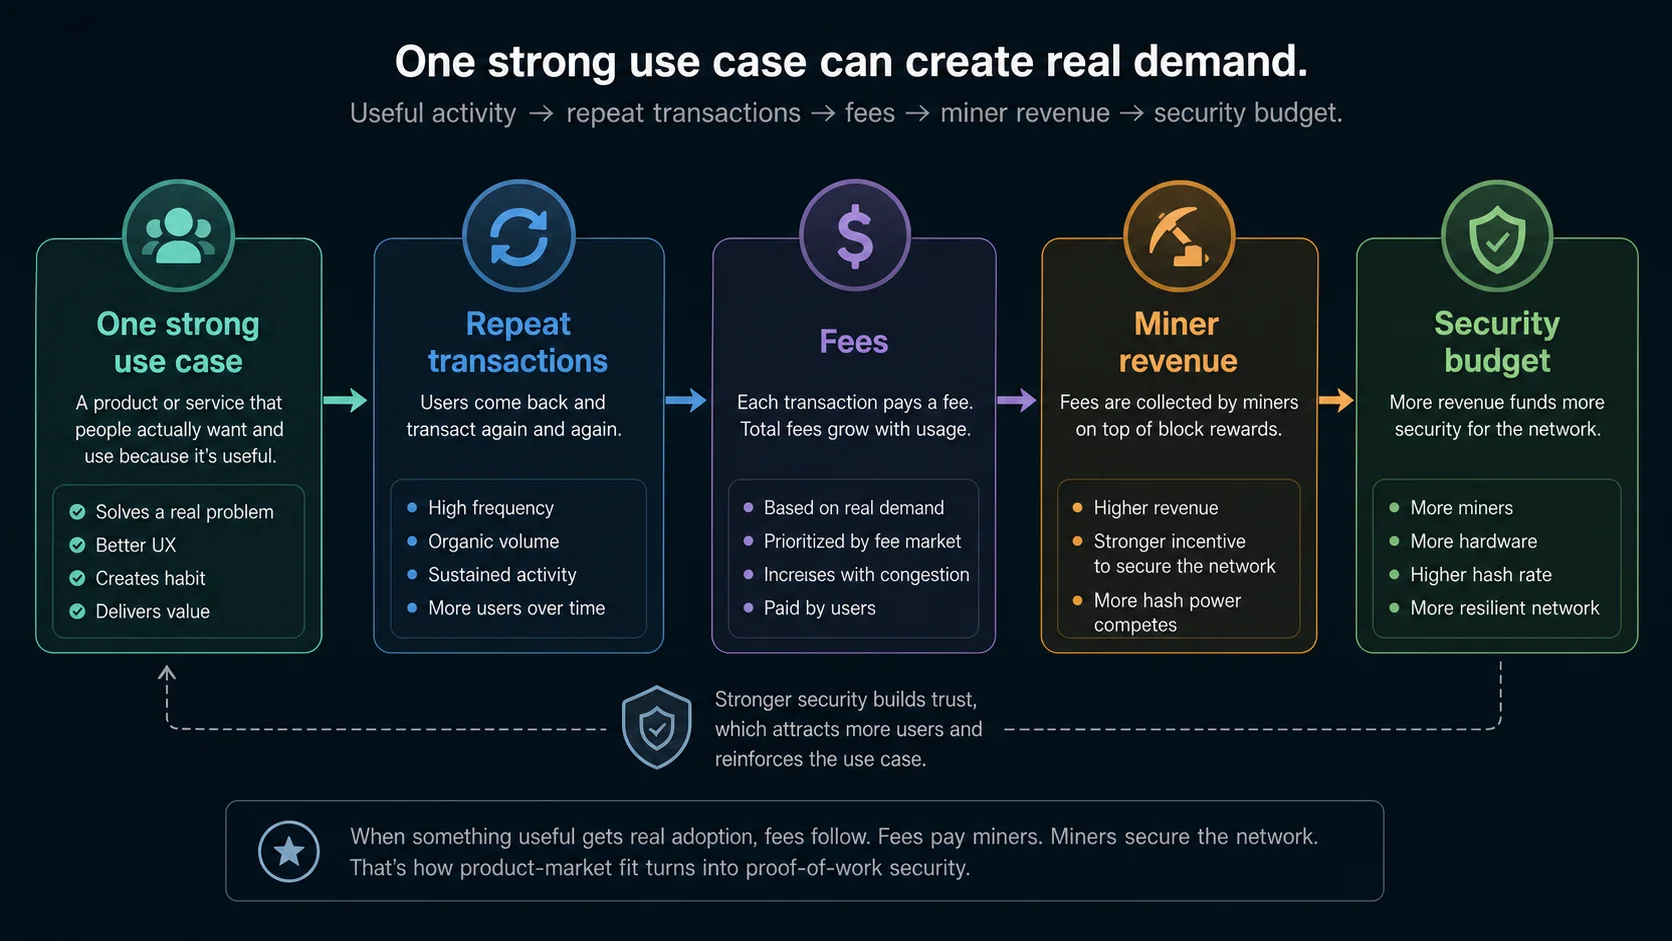
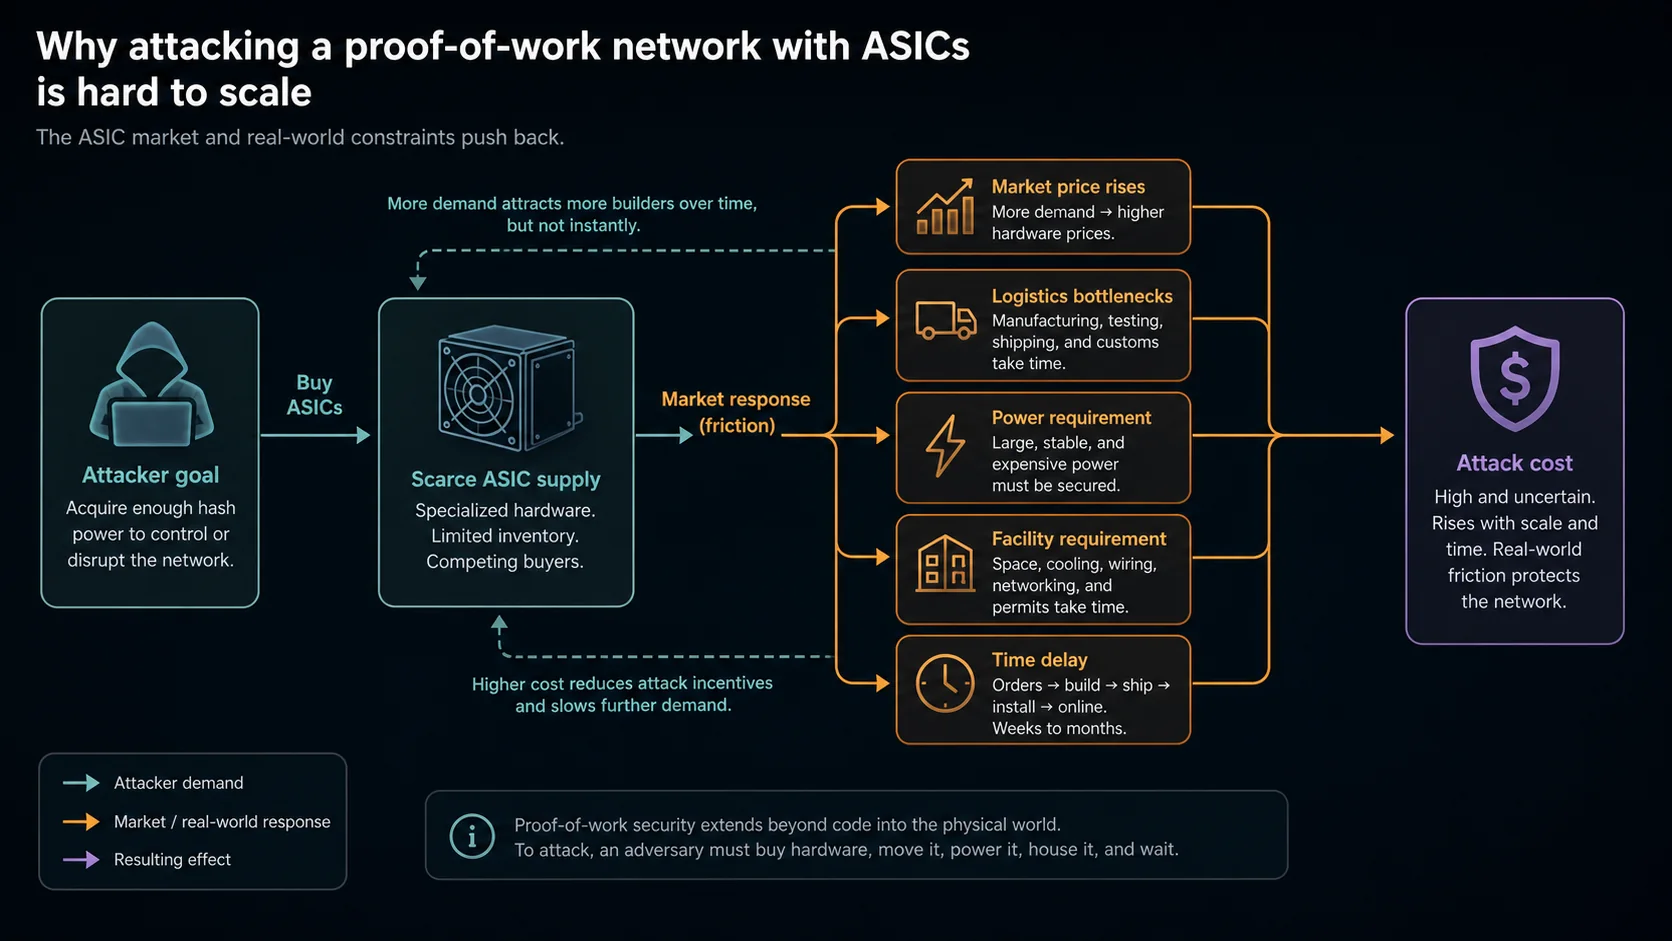
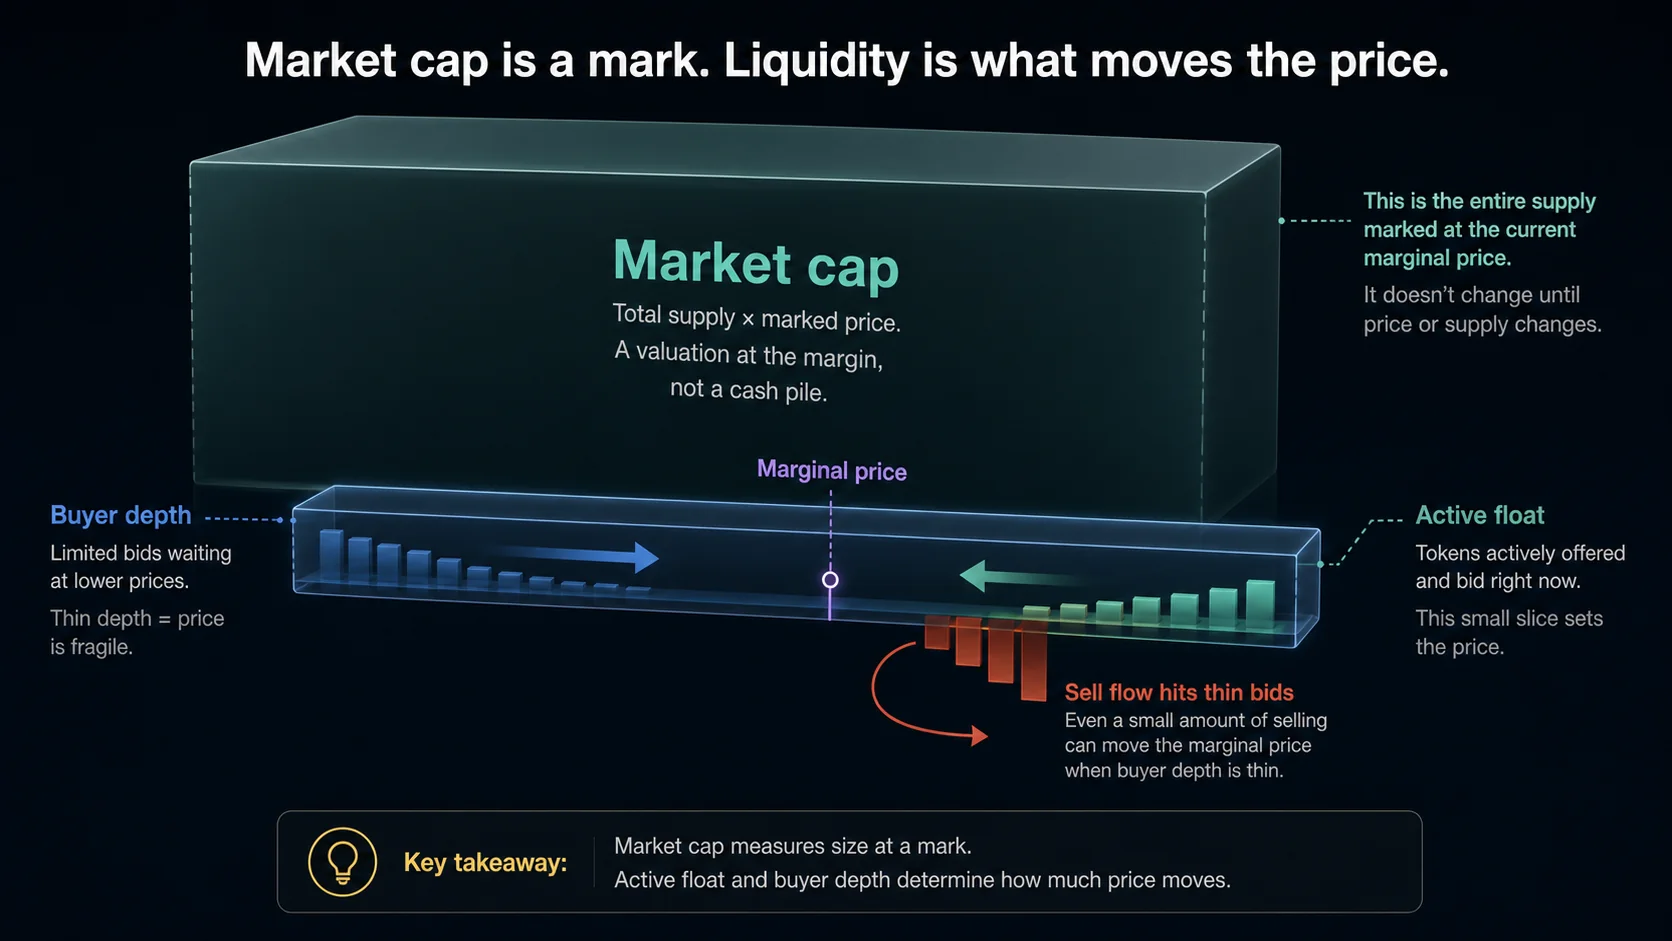
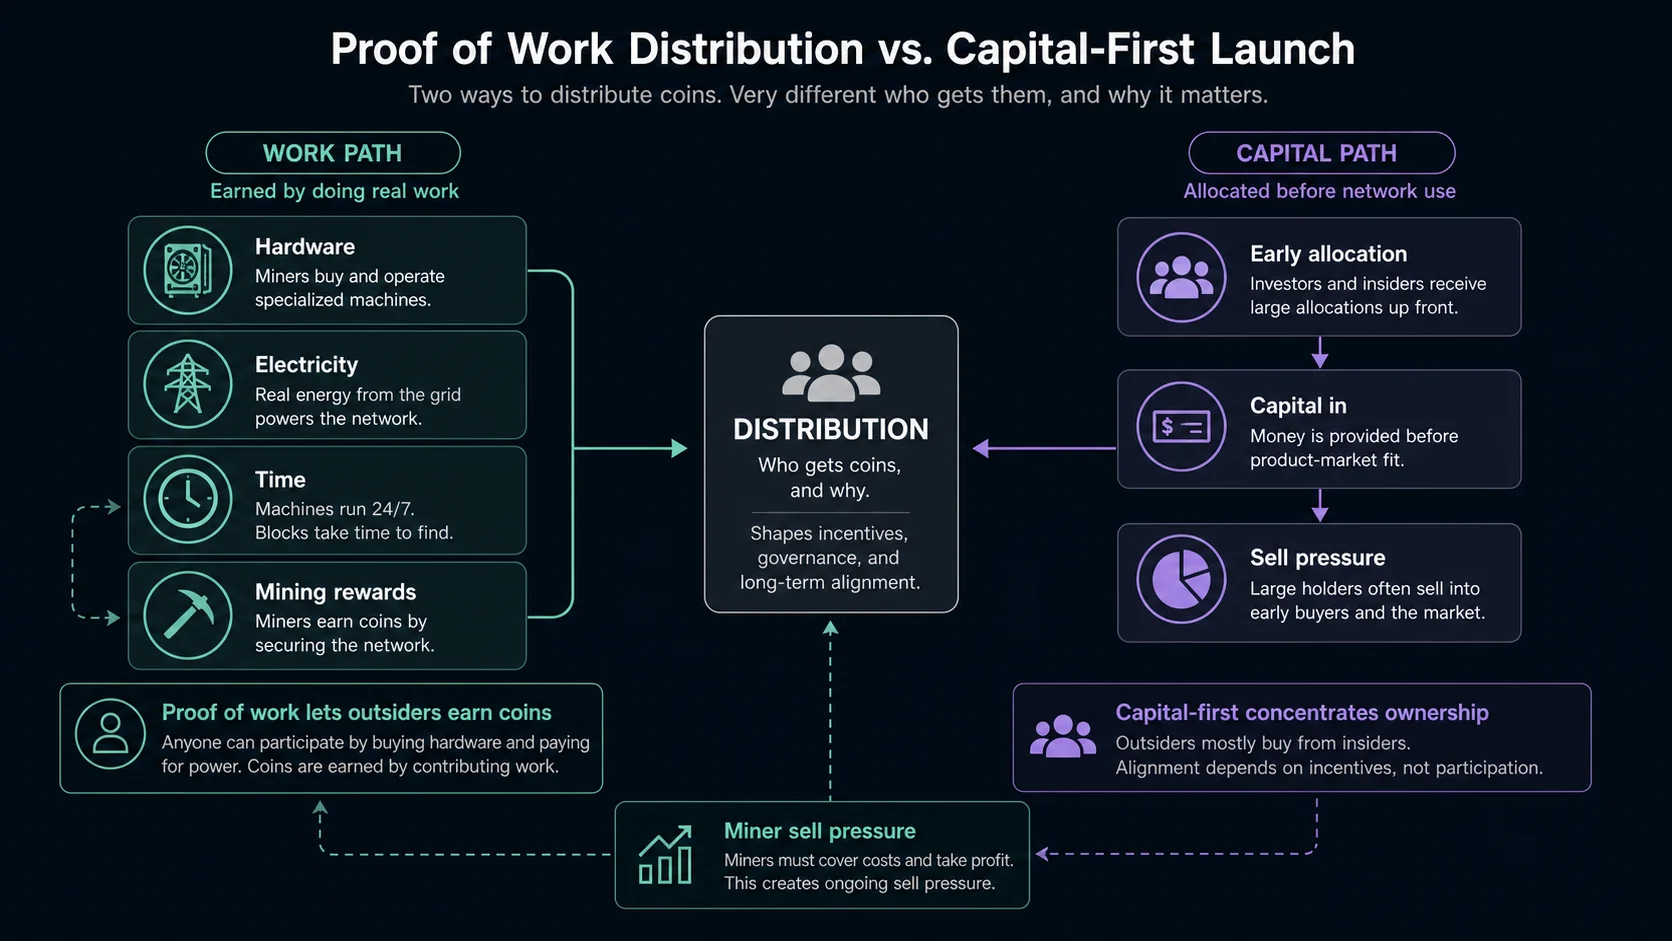
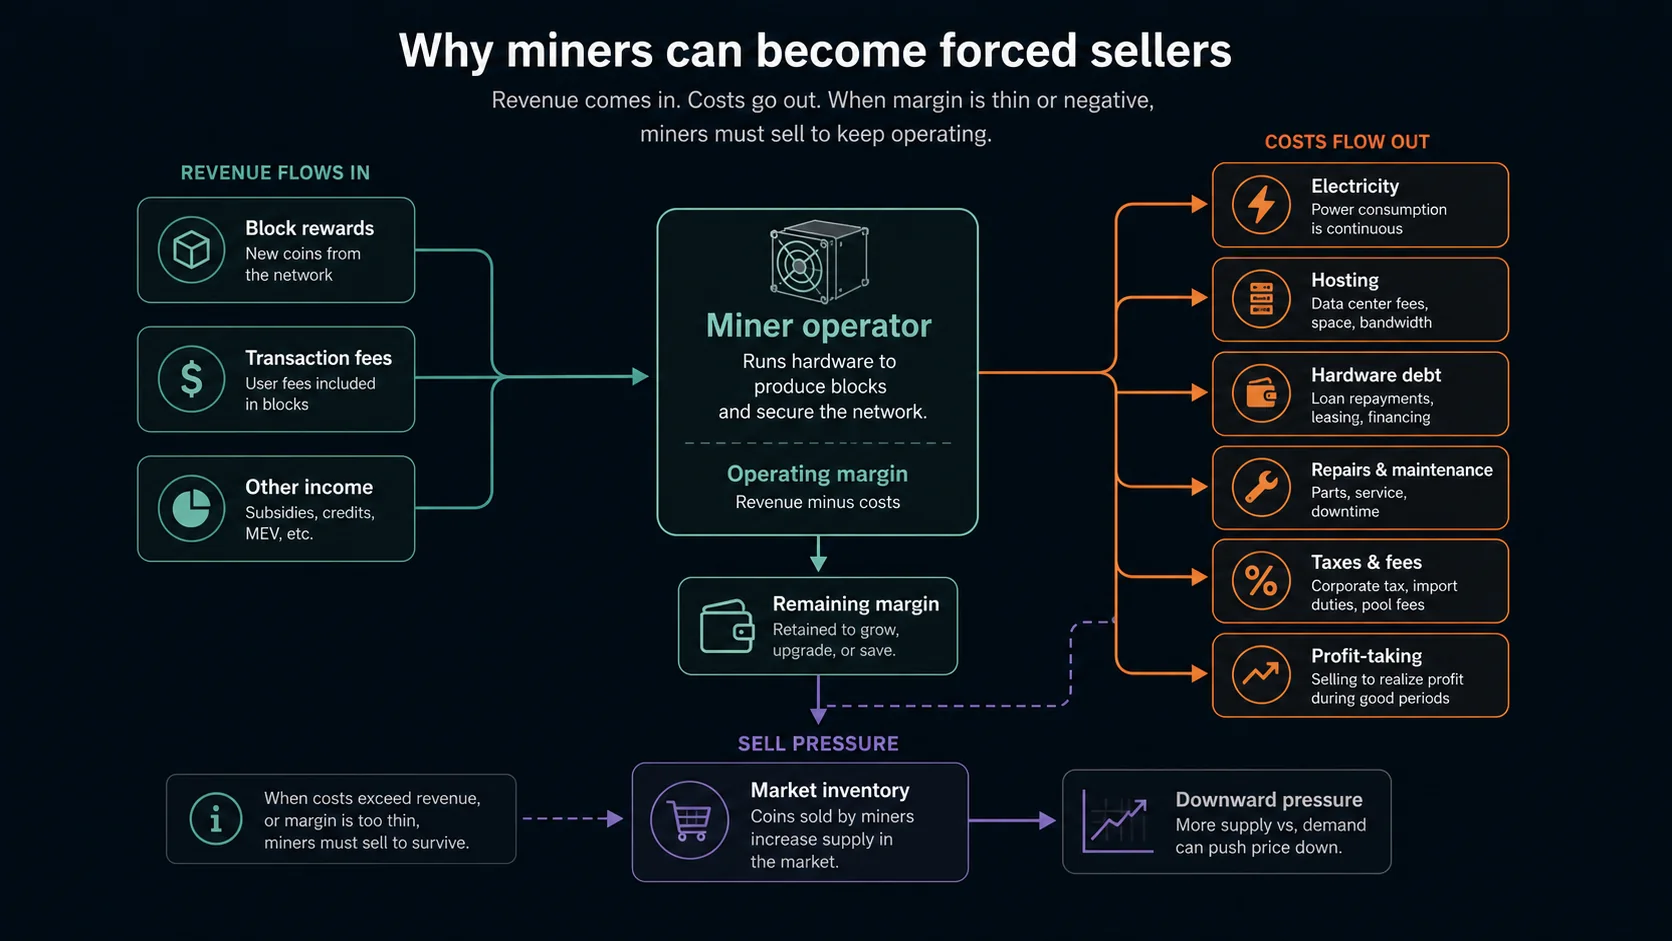
Proof of work is physical Machines, power, cooling, facilities, and time are part of the security story.Two markets, two clocks Price can move in minutes. ASIC orders, shipping, hosting, and difficulty move later.Hot and cold phases The useful idea is lag: price moves first, machines answer later, margins compress.Dated evidence receipt A useful format for checks. Current values should stay in editable text.Price and hash rate Direction can diverge because the hardware market lags the coin market.Attack cost A serious attack has to touch ASIC supply, power, facilities, logistics, and time.Fees later Issuance pays miners first. Fees have to matter more as rewards decline.Miner margin Price, reward, fees, difficulty, hardware, and electricity collide at the miner.Outside-world inputs PoW security is tied to hardware, electricity, cooling, capital, and time.Matrix view The cycle can be read as coin-market temperature and ASIC-market temperature.System map Coin demand, ASIC supply, miner margin, fees, and security budget feed each other.Linear versus log Linear charts emphasize dollar distance. Log charts show percentage moves.One use case One repeated, valuable use can create blockspace demand, fees, liquidity, and repricing pressure.ASIC market friction Buying enough machines can move the market and expose intent.Float beats headline supply in a selloff Active sellers and buyer depth move price at the margin.PoW distribution Coins can be earned with work, hardware, electricity, and time. That creates distribution and sell pressure.Miner selling pressure Miners can believe and still sell because power, hosting, debt, repairs, and taxes are real bills.
Source boundary
These images explain concepts from the mining-cycle article. They do not verify live price, hash rate, DAA, supply, reward, exchange depth, ASIC supply, or miner distribution. Use the article sources for dated checks.